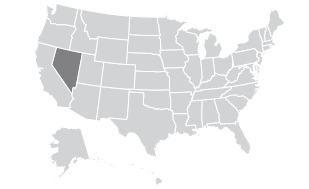
Democratic President Barack Obama holds a narrow, 5-point lead over Republican challenger Mitt Romney in Nevada, 50% Obama to 45% Romney, in a YouGov poll of 358 likely voters statewide (recontacted from an initial September poll).
| In Nevada (Oct 4-11): |
|---|
Nevada is somewhat partisan in its vote, as 80% of Democrats are sticking with Obama and 85% of Republicans are voting for Romney. |
Romney enjoys a large lead among likely voters who are Independents, 49% for Romney and 34% for Obama. |
Women favor Obama by 54%-44%, while men are essentially tied, 47% Obama-45% Romney. |
Obama enjoys a solid 55%-40% advantage in Clark County (Las Vegas). Romney leads big in Washoe County (60%-38%) and in the rest of the state (56%-38%). |
The oldest likely voters age 65+ favor Romney (52% Romney-46% Obama), Baby Boomers favor Obama slightly (49% Obama-45% Romney), and Obama wins the majority of votes from those under age 45. |
Among likely voters who are Independents, Romney’s lead is strong and has been fairly steady since September. Romney leads by a 15-point margin among Independent likely voters now (49%-34%), and he led by a 17-point margin in September (52%-35%). |
| Net Change in Voter Intention (Likely Voters) |
|---|
| Total | Independents | |||
|---|---|---|---|---|
Sept 7-14 | Oct 4-11 | Sept 7-14 | Oct 4-11 | |
Barack Obama | 51% | 50% | 35% | 34% |
Mitt Romney | 44% | 45% | 52% | 49% |
Republican candidate Dean Heller holds a 42%-36% lead over Democratic Senate candidate Shelley Berkley, largely unchanged from Heller’s 43%-37% lead in September, in a seat being vacated by retiring Republican Senator John Ensign
Voters in Nevada are divided in their choice for the U.S. House, as the Republican House candidates are nominally ahead of the Democrats, with 39% intending to vote for the Republican candidate for the House in their district and 38% for the Democrat. The poll was conducted online October 4-11, 2012.
Sampling method: Respondents were initially selected on September 7-14 from YouGov’s panel using sample matching. A random sample (stratified by age, gender, race, education, and region) was selected from the 2005–2007 American Community Study. Voter registration, turnout, religion, news interest, minor party identification, and non-placement on an ideology scale, were imputed from the 2008 Current Population Survey Registration and Voting supplement and the Pew Religion in American Life Survey. Matching respondents were selected from the YouGov panel, an opt-in Internet panel.
Respondents were recontacted on October 4-11 for the second wave of the YouGov poll. The percentage of likely voters who were successfully recontacted was 66.4%.
Weighting: The sample was weighted using propensity scores based on age, gender, race, education, news interest, voter registration, and non-placement on an ideology scale.
Number of respondents: 358 likely voters. Margin of error ±6.7% (adjusted for weighting).
Click here for September 7-14 results (registered voters).
Click here for October 4-11 results (likely voters).


