In 2010, YouGov polled every week for The Economist on vote intentions for the U.S. House of Representatives. YouGov also released results for 25 Governor and Senate races in the week prior to the election. These polls were all conducted on the Internet using YouGov’s sample matching methodology, where respondents were selected to match a random sample of the U.S. population.
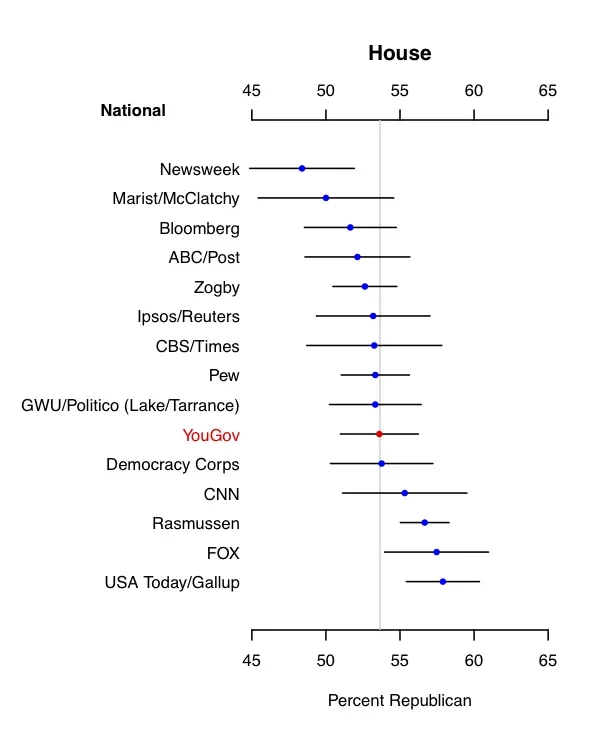
How well did we do? We hit the overall vote split for the House of Representatives almost perfectly. The final YouGov poll for The Economist showed a Republican lead of 52% to 45% among likely voters, matching exactly the 7% lead in counted vote for Republicans.
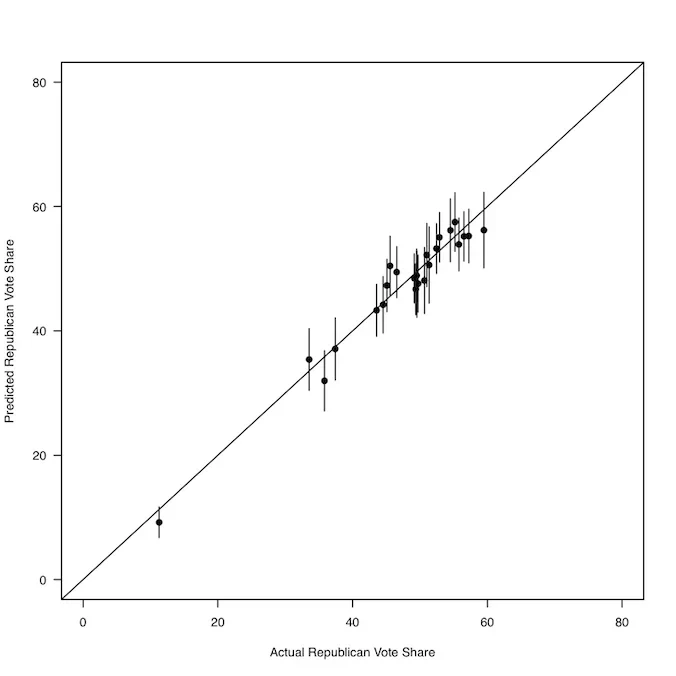
In general, of course, one should not expect samples to have errors this small. In the 25 Senate and Governor’s races polled by YouGov, the poll errors were consistent with normal sampling error. The polls exhibited no bias toward either Democrats or Republicans and the size of the polling errors were consistent with random sampling error. This confirms once again the validity of our sampling methodology.
Generic Congressional Ballot
In every week’s poll for The Economist, YouGov asked respondents which party’s candidate the intended to vote for in the election for House of Representatives. As in 2008, YouGov’s national estimate was right on target.
Summary of Overall Accuracy
Eleven polling organizations, including YouGov, released polls for five or more races after October 15, 2010. Overall, YouGov had a smaller mean absolute error than eight of these organizations (and slightly larger than two). Most of these polls were conducted using traditional phone sampling methods (random digit dialing) with live interviewers, which are much more costly to conduct than YouGov’s Internet-based methods.
Error Share in Republican Vote
| Number of Polls | Mean Error | Mean Absolute Error | |
|---|---|---|---|
Quinnipiac | 11 | 0.4 | 1.3 |
SurveyUSA | 21 | -0.4 | 1.5 |
YouGov | 25 | 0.2 | 1.7 |
PPP | 33 | 0.1 | 2.1 |
CNN | 13 | 0.6 | 2.3 |
Suffolk | 6 | -1.2 | 2.4 |
Fox News | 14 | 0.8 | 2.6 |
Marist | 7 | 2.7 | 2.7 |
Ipsos | 6 | 2.0 | 2.7 |
Mason-Dixon | 15 | -0.7 | 2.8 |
Rasmussen | 54 | 1.0 | 3.4 |
Among pollsters conducting 5 or more polls between Oct. 15-Nov 1, 2010 | |||
We measure poll error as the percentage error in the estimate of Republican vote share. To calculate this error, undecided and minor party voters are omitted, and the Republican vote is calculated as a percentage of major party vote in both the poll and the election returns. YouGov’s polls appeared to be unbiased: across 25 polls, the Republican vote share was overestimated by only 0.2%. The average absolute error was 1.7%, which is consistent with the theoretical level of sampling error (with ignorable selection and post-stratification on propensity scores).