
Last week, the Pew Research Center released a report "Evaluating Online Nonprobability Surveys," co-authored by Courtney Kennedy and six of her Pew colleagues. The study was released a few weeks before the annual American Association for Public Opinion Research (AAPOR) conference and attracted quite a bit of interest in the survey community. Pew is unique in having the resources and inclination to do careful methodological studies like this. The study is a model of careful design and judicious interpretation.
The study conducted ten parallel surveys--nine conducted on opt-in web panels and one on Pew's own American Trends Panels (ATP). ATP is a so-called "probability panel" recruited off of Pew's telephone random-digit dial (RDD) telephone surveys. This uses a proper sampling frame (phone numbers) and, in principle, can reach everyone with a phone number (since respondents without email addresses are offered the option of answering by physical mail). The nine opt-in panels use a variety of recruitment methods and allow almost anyone to join. They do not include anyone without web access and use purposive sampling methods (usually demographic quotas) to assemble "representative" study samples.
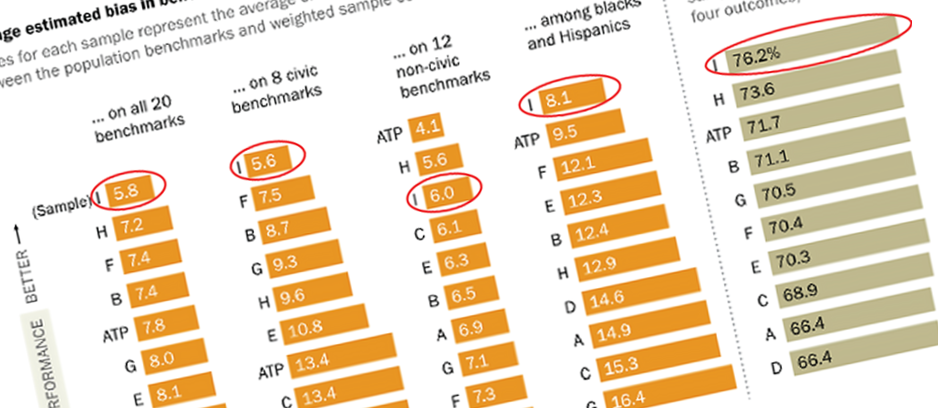
The headline results of the study, as summarized by Pew, were that "Vendor choice matters; widespread errors found in estimates based on blacks and Hispanics." In particular, one of the samples--labeled "Vendor I" in the report--"consistently outperformed the others including the probability-based ATP." This led to quite a bit of speculation about who was "Vendor I" and how they managed to do better. Scott Clement of the Washington Post asked "Has someone cracked the code on making Internet polls more accurate?" Both he and the Pew report attribute the differences on the use of non-demographic variables, such as party identification and political ideology. These are, as the Pew report notes, "variables that are treated as survey outcomes" and this "raised important questions"--a point also made by Margie Omero on The Pollsters podcast. I'd like to clear up some misconceptions about these issues.
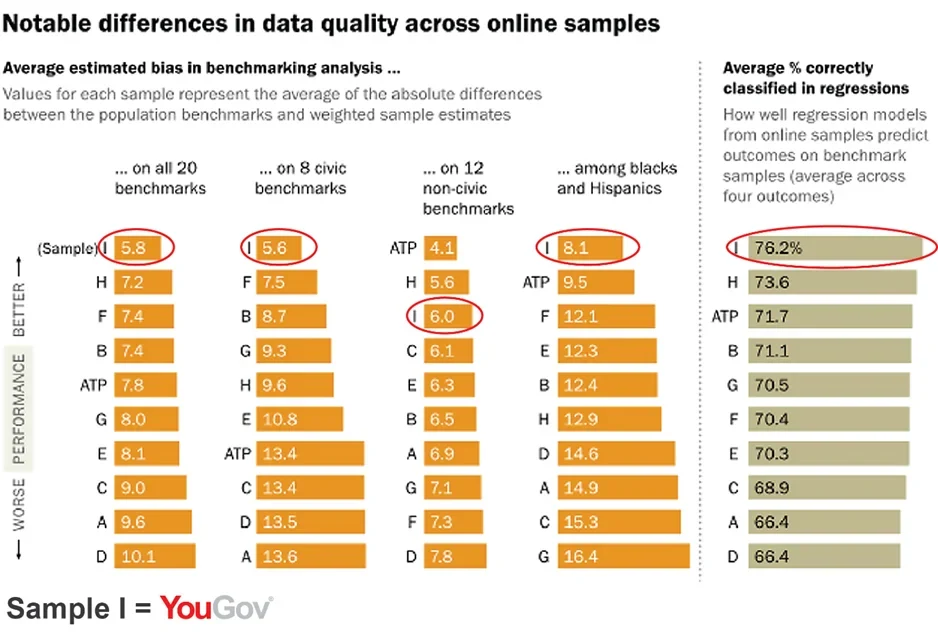
To eliminate the suspense, Pew notified YouGov that we were "Vendor I," which was gratifying However, the main finding--that balancing samples on a few demographics does not remove selection bias in either probability-based or non-probability samples--is not new (I've been saying the same thing for over a decade) and the concerns about sampling on variables other than demographics are overblown. There is some validity to the conclusions about minority samples, though again, this is largely a fixable problem. Let me elaborate a bit.
WEIGHTING BY NON-DEMOGRAPHICS
There is nothing sacrosanct about demographics. These are convenient variables to weight by since there are official statistics (sometimes misleadingly referred to as "the Census") available on many demographics. However, you can weight on anything, so long as its distribution is known. Most demographic variables come from either the Current Population Survey (CPS) or the American Community Survey (ACS)--very high quality samples conducted by the Bureau of the Census (but different from the decennial census). In November of even-numbered years, the CPS also asks about voter registration and turnout. We also have election returns (which tell us how many people voted Democratic or Republican) and exit polls (with about response rates around 50%) with detail on attitudes and voting for different types of voters. There are other relatively high response rate surveys, such as the American National Election Survey (ANES) and General Social Survey (GSS) which ask about religion, party identification, political ideology, interest in politics, and other attitudinal variables. While it has been traditional to limit survey weighting to a few demographics, non-demographics can be used if there are reliable benchmarks for these variables.
Not only is weighting by non-demographics not a mistake, it is a necessity for most surveys today. Both phone and internet samples tend to have people with above average levels of political interest. Voter turnout rates in both phone and internet samples, even after correcting for demographic imbalances, are often close to 90%. It has long been known that phone samples over-represent people with college or post-graduate degrees and the problem is even worse for most internet panels. This means that samples contain too many people with high levels of news consumption and ideological sophistication. Survey cooperators report significantly higher rates of volunteering and organizational membership. And the list goes on. Some survey methodologists have been in denial about this problem, pretending it doesn't exist and discouraging efforts to fix it.
WEIGHTING BY JOINT RATHER THAN MARGINAL DISTRIBUTIONS
The most common weighting procedure remains raking or rim-weighting, which dates from the 1940's. This technique only requires the marginal distribution of the weighting variables, so it is easy to implement, and seems to work well for minor sample imbalances. It can, however, be a disaster for correlated variables with substantial imbalances. For example, both phone surveys and internet panels underrepresent minorities and people with high school education or less. However, the raking model (and it is a "model," despite claims to the contrary) assumes no interactions among the weighting variables, while minorities with low education are in especially short supply in these samples. Raking on race and education separately often leaves the average education level of minorities above that of non-minorities, because minorities who respond to surveys tend to have relatively high levels of education. This is especially a problem for marginal quotas, which pay no attention to the distribution of respondents within quota cells, which is why we don't use them at YouGov. The solution is to weight by the joint distribution of these variables. We have spent quite a bit of effort at YouGov modeling the joint distribution of data from multiple surveys--CPS, ACS, ANES, GSS, and the NEP exit polls. We've provided detailed explanations of how we do this, but, to my knowledge, no one else has bothered to copy us.
WEIGHTING BY OUTCOMES
It is, however, dangerous to weight by variables which can change if the benchmarks are out of date. Election years typically exhibit some variation in party identification and weighting to an old benchmark would miss these movements. The same could be true of political ideology. This is why we generally avoid weighting to CURRENT party identification or political ideology at YouGov. We do weight samples to the number of persons saying they identify with a third party (i.e., who say they are neither Democrats or Republicans or Independents) or who are unable to place themselves on a five-point ideology scale. The size of these two groups is quite stable over time and, not surprisingly, internet panels tend to over-represent the former and under-represent the latter. We also select (but usually do not weight) samples based on baseline party identification and ideology (not the current values). For example, instead of using current party identication or recalled vote choice, we try to use the answers people gave at the last election. We have good benchmarks for party ID and ideology at in November 2012 or 2014 and selecting (or even weighting) the prior measurements to accurate contemporary benchmarks isn't a problem. This is an advantage of panel-based research that often isn't appreciated by researchers who conduct single-shot telephone interviews.
RELY UPON PURPOSIVE SELECTION TO MINIMIZE THE NEED FOR WEIGHTING
The Pew ATP panel uses a methodology similar to that developed at Knowledge Networks, which I co-founded in 1998 (and since 2012 has been part of GfK). It is "probability-based" in the sense that the initial recruitment, by phone or mail, starts with random selection. However, we learned early on that non-response and attrition destroyed any claim to being a true probability sample. (Alas, the company's marketing neglected to mention that the response rate hovers around 2%, giving the misimpression that it is actually a probability sample) Randomly sampling a panel, even a pretty good one like the Knowledge Panel or ATP, means that you have to use fairly large weights to correct for sample imbalances. A much better strategy, which we developed at Knowledge Networks, was to select subsamples to be representative and minimize the need for weighting. This is purposive sampling, since it relies upon outside sources for the distribution of some variables. If the ATP panel were larger, it too could use this strategy, but it is limited currently by its size. The main advantage of large opt-in panels is the ability to select subsamples that are representative of the population in terms of a larger number of variables. At Polimetrix (and now YouGov), we use matching methods to improve representativeness on a wider array of variables when the curse of dimensionality becomes a problem.
Survey research is in a time of transition. The difficulty and cost of executing probability sampling designs has prompted research into non-probability methods. This doesn't mean that anything goes. There are more or less effective ways to use online panels, though, as the Pew report demonstrates, most vendors are doing little more than quota sampling and (sometimes) a bit of old-style weighting. The Pew report is a valuable addition to this literature. We're happy that it shows that our efforts have practical value and we remain committed to seeking further improvements.