

Pepperoni continues to reign atop Americans' pizzas.
A new YouGov survey reveals that America’s favorite pizza topping is pepperoni, with 24% listing this as their favorite topping. Pepperoni has many lovers and few haters: Fewer than 1% say it's their least favorite topping. Sausage is a distant second (13%), followed by extra cheese (11%), mushrooms (9%), and chicken (6%).
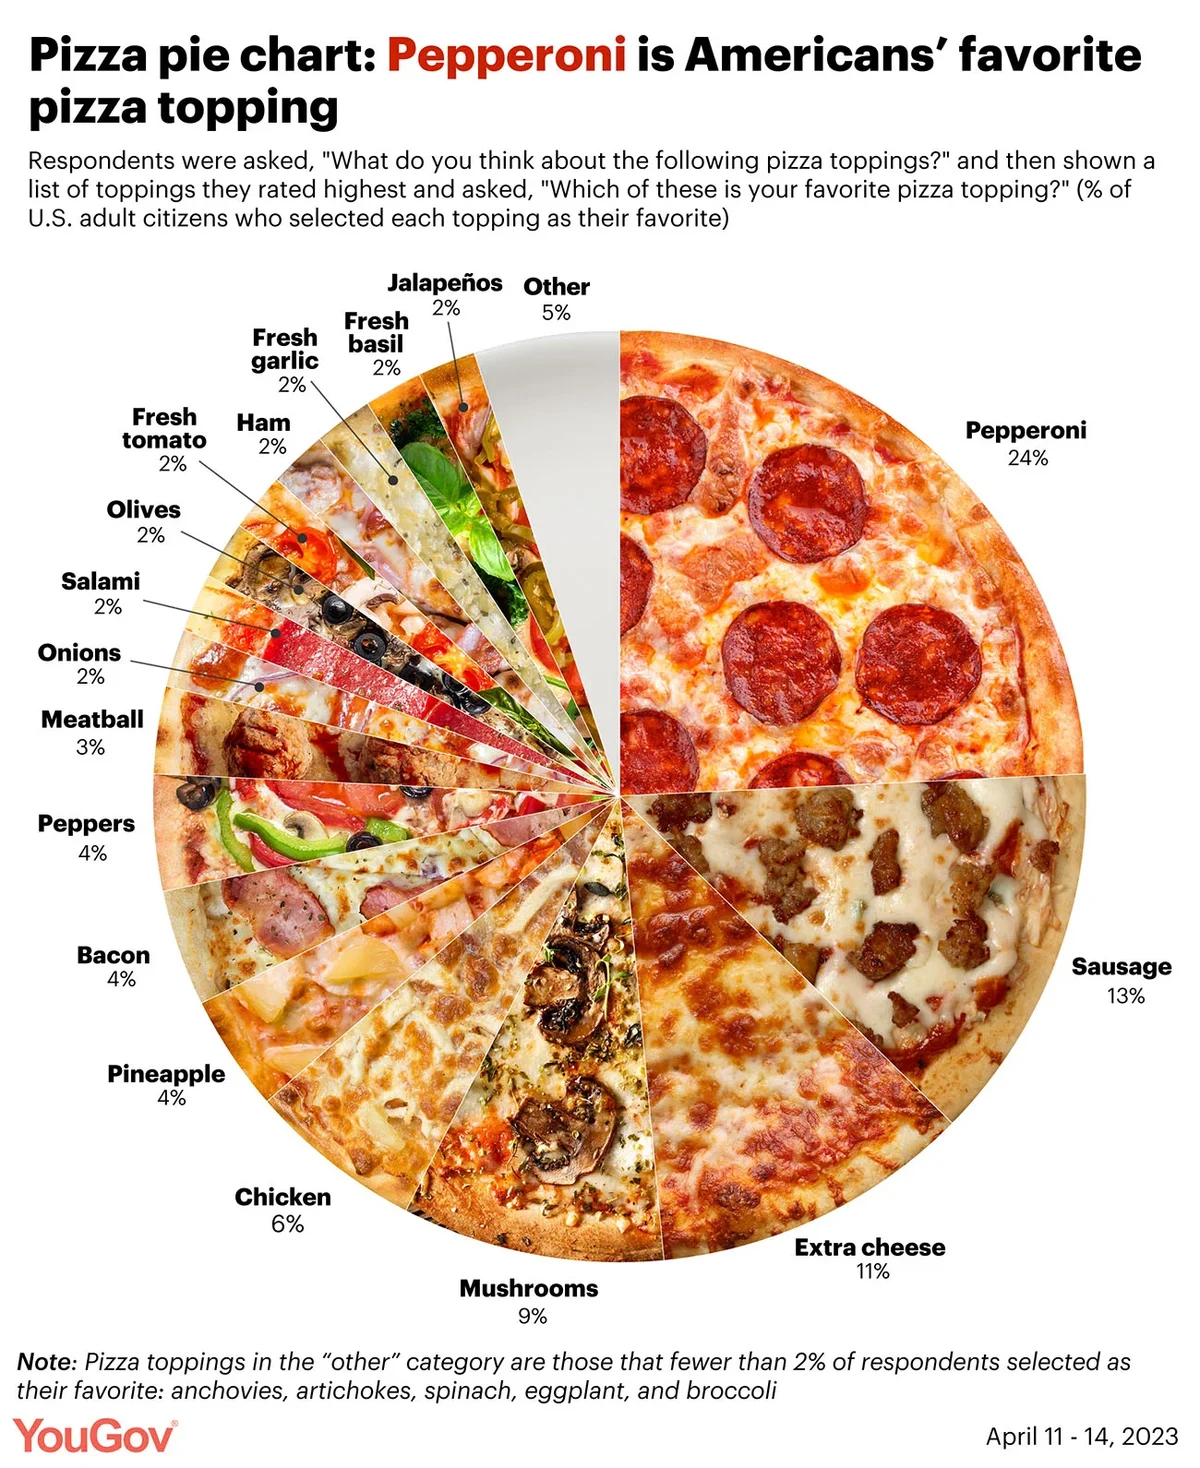
The nation’s least favorite pizza topping is anchovies: 29% say it's their least favorite. You could say anchovies are polarizing but people lean hard to one pole: Only 1% name them as their favorite topping. Jalapeños (8%), pineapple (6%), eggplant (6%), broccoli (5%), and mushrooms (5%) follow — far behind.
Before asking about favorite and least favorite toppings, the survey asked Americans to evaluate toppings on a scale from “love it” to “hate it.” (Each respondent then chose their favorite and least favorite toppings from among those they listed as their most liked and disliked.) The most-beloved pizza topping is extra cheese, which 51% of Americans say they love and 33% like. Pepperoni is effectively tied: 50% say they love it and 32% like it. The next most-loved topping is sausage (44%), followed by mushrooms (41%), peppers (34%), onions (33%), bacon (33%), and fresh garlic (32%).
And — with apologies to 77% of Italians — 22% of Americans love pineapple on their pizza. Another 37% like it, while 18% dislike it and 19% hate it.
What about the most hated toppings? Four in 10 (42%) hate anchovies, 28% hate eggplant, 26% hate artichokes, 24% hate jalapeños, and 22% hate broccoli.
Beyond toppings, the survey also asked Americans about their preferences when it comes to pizza crusts, slice shapes, dipping sauces, and more pressing pizza practices.
Most Americans (79%) are eating their pizza crust, though about one in five (19%) say they don’t eat the edge of the pizza with no sauce. When it comes to crust style, the largest share of Americans (39%) prefer thin-crust pizza, while 30% say they prefer a thick crust. Fewer (16%) prefer a stuffed-crust pizza and 14% say they don’t have a preference.
Thin-crust pizza also frequently is called New York-style pizza. When asked about preferences among eight regional styles, 27% say New York-style is their favorite. Chicago-style pizza — often called deep dish — comes in second with 19%, followed by Detroit-style pizza at 4%. Many pizza eaters favor a style that’s associated with their region. Northeasterners are particularly likely to favor New York-style pizza, at 47%; Midwesterners are most likely to favor Chicago-style pizza (30%). Among people who live in the West, 19% prefer California-style pizza — though about as many (18%) prefer New York-style pizza.
While the majority of people (75%) prefer their pizza be cut in triangular slices, 15% prefer a square slice and 5% prefer their pizza cut in strips.
How do Americans eat their pizza? The largest share (73%) eat it with their hands, but 11% usually eat pizza with a fork and knife.
The majority of Americans enjoy a dipping sauce with their pizza. About a quarter (23%) say they typically have marinara sauce with their pizza, and 23% have garlic butter. A similar percentage (22%) say they dip or add ranch dressing to their pizza, and fewer (12%) have it with hot sauce.
— Carl Bialik and Taylor Orth contributed to this article
Related: Americans' favorite and least favorite months of the year
See the toplines and crosstabs for this YouGov poll
Methodology: This poll was conducted online on March 11 - 14, 2023 among 1,000 U.S. adult citizens. Respondents were selected from YouGov’s opt-in panel using sample matching. A random sample (stratified by gender, age, race, education, geographic region, and voter registration) was selected from the 2019 American Community Survey. The sample was weighted according to gender, age, race, education, 2020 election turnout and presidential vote, baseline party identification, and current voter registration status. Demographic weighting targets come from the 2019 American Community Survey. Baseline party identification is the respondent’s most recent answer given prior to March 15, 2022, and is weighted to the estimated distribution at that time (33% Democratic, 28% Republican). The margin of error for the overall sample is approximately 3%.
Images — Cover Image: Adobe Stock (Prostock-studio); Pizza images: Pepperoni (Adobe Stock, danilsneg); Sausage (Getty Images, Jupiterimages); Extra cheese (Adobe Stock); Mushrooms (Adobe Stock); Chicken (Adobe Stock); Pineapple (Adobe Stock); Bacon (Adobe Stock, boomeart); Peppers (Adobe Stock, Yeti Studio); Meatball (Adobe Stock, Food Shop); Salami (Adobe Stock, Andrew Buckin); Olives (Adobe Stock, denisval); Fresh tomato (Adobe Stock, Grafvision); Ham (Adobe Stock, tokkyneo); Fresh garlic (Adobe Stock, wanchai); Fresh basil (Adobe Stock, vm2002); Jalapeños (Adobe Stock); Other plate (Adobe Stock, Freedom Life)