
In the 2014 midterm elections, YouGov polled every state and congressional district. This note provides detailed information about the performance of YouGov's Senate polls. An analysis of the House polls can be found here.
YouGov polled Senate races four times for CBS News and the New York Times over the course of the campaign with interviewing in the final wave between October 16 and 23. In addition, we conducted separate polls, independent of the CBS/New York Times Battleground Tracker, in the week before the election (October 25-31). These results use our final poll estimates in those five states rather than the earlier results in the Battleground Tracker. The results would be similar using only the Battleground Tracker.
Figure 1: Accuracy of YouGov Senate Estimates
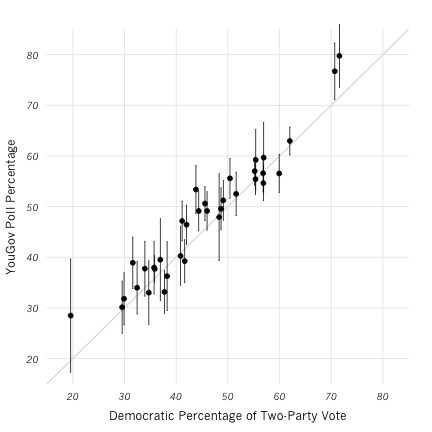
In terms of getting the outcome right, we did fairly well (only missing in Iowa and North Carolina, where we gave Democrats leads of 1.0% and 2.1%, respectively). However, from the scatterplot in Figure 1, it is evident that we had a consistent overstatement of the Democratic vote. On average, our polls over-estimated the Democratic share of the two party vote by 2.0%. This was not unusual – most polls this year overstated Democratic performance – but this is a larger average bias than we have encountered in previous years.
The vertical bars in the figure represent the reported margin of error in each of our polls. Where the vertical line crosses the 45° line, the outcome was within the reported margin of error. Our reported margins of error were too small in about a quarter of the races. This occurred mostly in states where the sample size was large and non-sampling errors were more important than conventional sampling formulas would indicate.
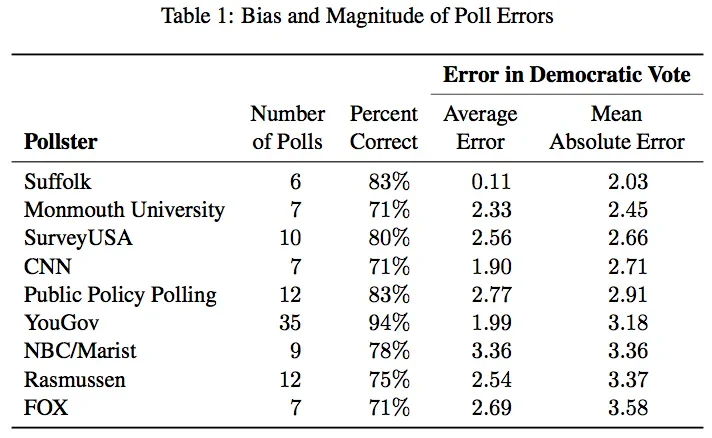
Table 1 compares the mean error and mean average error for organizations that polled five or more Senate contests. The mean error is a measure of bias, with positive values indicating an over- statement of Democratic vote and negative values an understatement. The mean absolute error is the best overall measure of accuracy (giving the average magnitude of polling error, regardless of direction). The average absolute error ranged from 2.0% (for Suffolk) to 3.6% (for Fox), with YouGov in the middle of the pack. Every pollster except Suffolk exhibited a Democratic bias of around two percent, though YouGov’s was slightly smaller than the others. Our percentage of correct leaders was higher, but this is not really a fair comparison (since we polled a large number of uncompetitive races).
This was a difficult year for polling. Results tended to be sensitive to which likely voter screen was employed, the treatment of undecided voters, and weighting methods. We used a simple likely voter screen (respondents who said they would “definitely” or “probably vote”) which appears to have yielded a more Democratic electorate than actually voted. Further, anyone who leaned to a candidate was counted as a vote for that candidate. In post-election surveys, we plan on recontacting all voters to determine whether these respondents actually voted and, if so, for whom. Further, our state-level samples included large over-samples of competitive congressional districts. In an attempt to maximize sample size in these districts, we encountered various skews which presented continuing challenges for proper weighting.
The full set of state level estimates and errors are presented in an appendix.
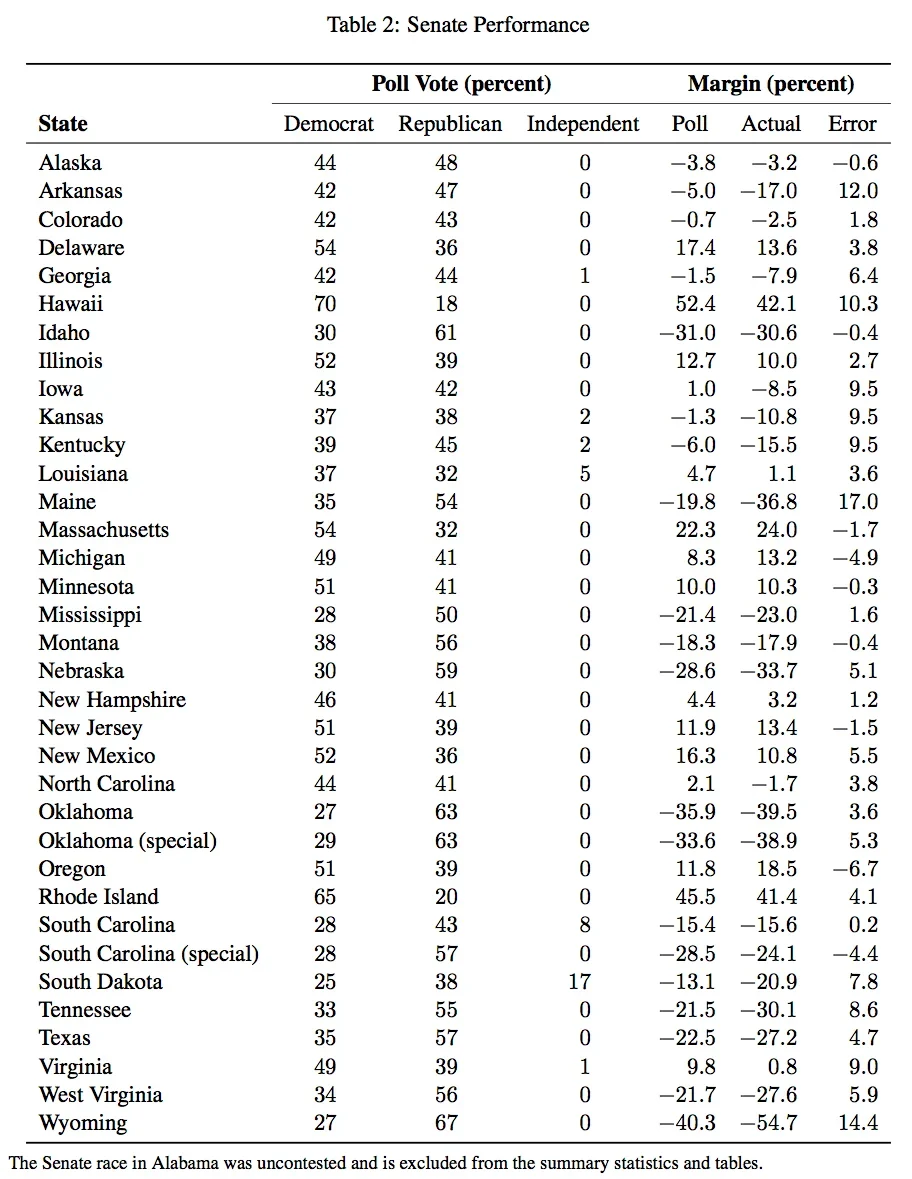
Image: PA
This article has been updated to correct an error in Table 1. The results for SurveyUSA were reported incorrectly. Updated again on November 18, 2014 to reflect new vote counts.