
The United States has a very caffeinated population.
Three-quarters of American adults drink coffee — and most (53%) drink at least one cup per day, according to a new YouGov poll conducted September 21 - 25. Coffee drinkers in the United States also are more likely to sip caffeinated coffee (79%) than decaf (10%), though some drink both (10%). While they heavily favor the caffeinated variety, the country's coffee drinkers have a broader range of preferences when it comes to types of coffee drinks, whether they want milk or sugar, and whether those cups o' joe are good for them.
How Americans view various coffee drinks
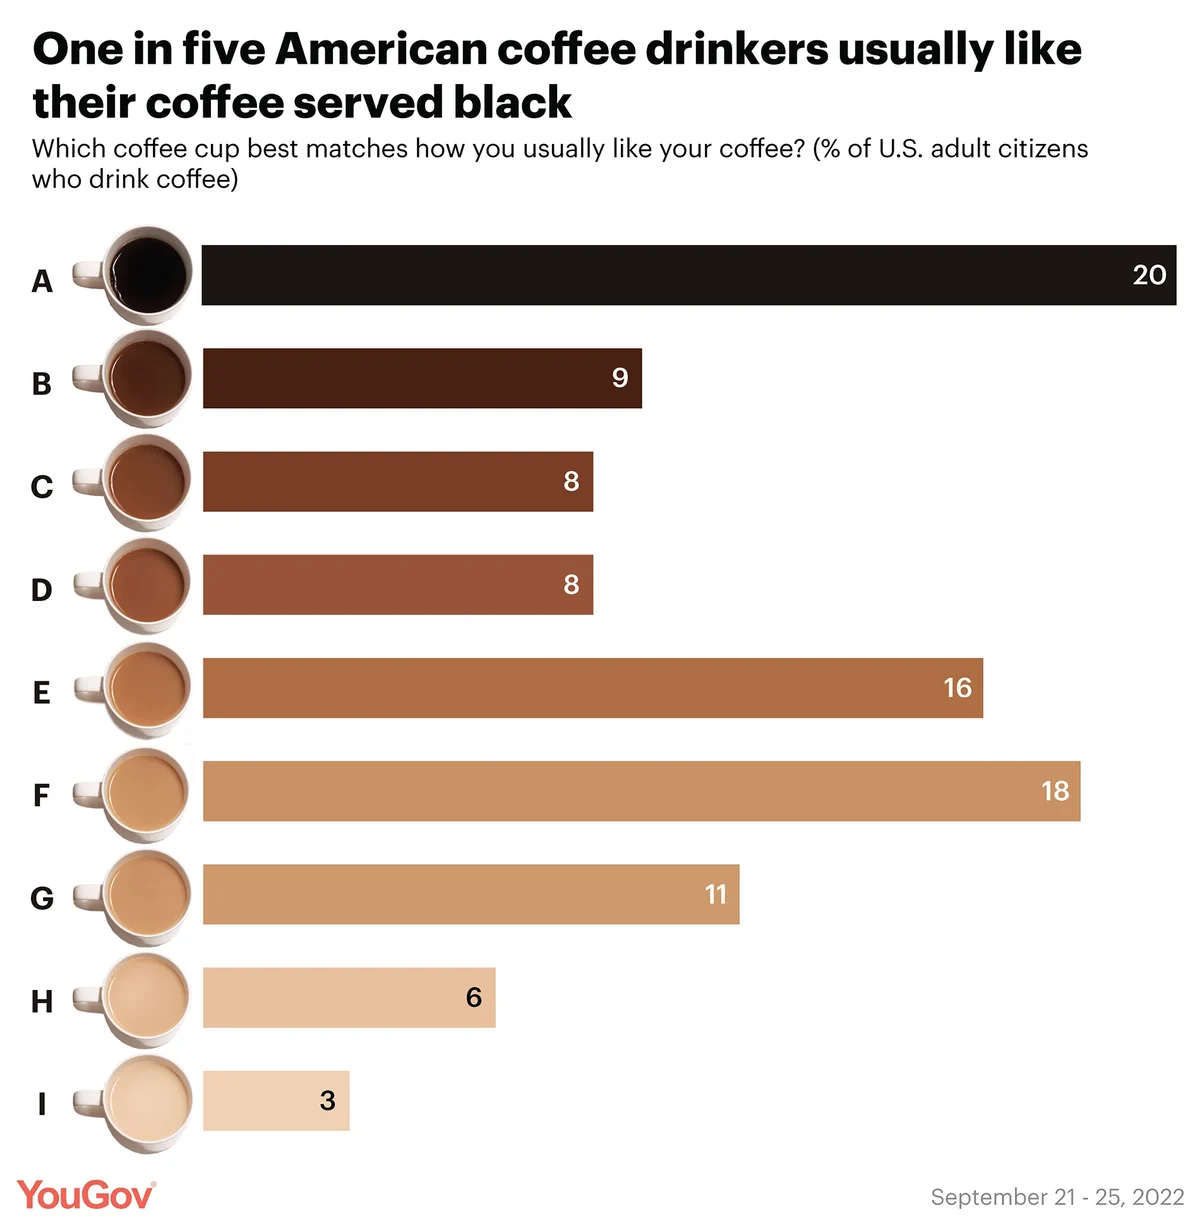
Most American coffee drinkers say they "love" (51%) or "like" (37%) regular coffee — though many like it with milk, sugar, or creamer mixed in. When shown a photo of nine coffee cups with varying hues of coffee, 79% of coffee drinkers choose a brown, golden, or cream-colored cup. Just one in five coffee drinkers (20%) say they prefer their coffee black.
While Americans overall have the highest affection for regular coffee, they also have a net positive view of other beverages that are available at many coffee counters. Coffee drinkers in the U.S. are more likely to "love" or "like" than "dislike" or "hate" cappuccino (55 percentage points more likely to view positively than negatively), latte (+44), mocha (+44), frappuccino (+41), iced coffee (+38), espresso (+30), macchiato (+30), Americano (+26), and cold brew (+17).
Some coffee drinks clearly are favored by younger coffee drinkers. For instance, most 18- to 29-year-olds say they love (54%) or like (31%) iced coffee — making them much bigger fans than any other age group (though 30- to 44-year-olds are more likely than Americans overall to love or like the beverage). Americans under 45 are also more likely to love lattes, cappuccinos, frappuccinos, and many other coffee-based beverages that are not simply regular coffee. Regular coffee is the only beverage that older coffee drinkers love more than coffee drinkers who are 44 and younger.
When coffee consumption begins for Americans
More than one-third of Americans (36%) didn't start drinking coffee regularly until they were at least 21 — though lately, coffee drinkers appear to have gotten an earlier start. Nearly half (47%) of coffee drinkers who are 65 and older started drinking coffee regularly at age 21, compared to just 18% of 18- to 29-year-old coffee drinkers. About half (47%) of 18-to 29-year-olds who drink coffee started their regular consumption at 16 or younger.
There has been a big decline in support for young coffee drinkers from 74 years ago. In a 1948 poll conducted by the Roper Organization, 62% of women 18 and over said that children should be able to drink coffee by their 16th birthday. Revisiting this question today is part of an ongoing YouGov series in which we ask questions previously asked on polls decades ago to track long-term changes in American opinion.
How many coffee drinkers experience withdrawal symptoms?
Drinking coffee regularly can have a dark side. Three in 10 Americans who drink caffeinated coffee (31%) say they experience adverse side effects when they abstain from drinking it. The most commonly reported side effects among people who share this problem are headaches (75% say this happens to them with coffee withdrawal), irritability (42%), and fatigue (20%). People who started drinking caffeinated coffee by age 20 are more likely to report adverse side effects from coffee withdrawal than are people who started drinking when they were at least 21 (37% versus 22%).
Most coffee drinkers (59%) say they do not experience side effects from coffee withdrawal. And coffee drinkers (45%) also are more likely than non-coffee drinkers (11%) to say moderate coffee consumption is beneficial to a coffee drinker's health.
– Carl Bialik, Taylor Orth, and Oana Dumitru contributed to this article
This poll was conducted on September 21 - 25, 2022 among 1,000 U.S. adult citizens. Explore more on the methodology and data for this poll.
Roper Poll Methodology: Older surveys were conducted via face-to-face interviews between January 2 - 26, 1948 by The Roper Organization. Results and question-wording were retrieved via Roper’s iPoll database.
Image: Adobe Stock (Syda Productions)