The budget deficit may not be the number one issue for most Americans (the economy takes top place), but for some, it is a close second. In the latest Economist/YouGov Poll, just over a quarter of Tea Party identifiers rank it as priority number one.
Which of these is the most important issue for you?
| Total | Tea Party Followers | |
|---|---|---|
The war in Iraq | 0% | 0% |
The economy | 35% | 35% |
Immigration | 3% | 9% |
The environment | 3% | 0% |
Terrorism | 3% | 6% |
Gay rights | 2% | 1% |
Education | 8% | 1% |
Health care | 14% | 8% |
Social security | 12% | 8% |
The budget deficit | 13% | 27% |
The war in Afghanistan | 2% | 1% |
Taxes | 4% | 6% |
For Republicans and independents, the deficit ranks number two. Relatively few Democrats name it. And for those 65 and older, the top concern is Social Security.
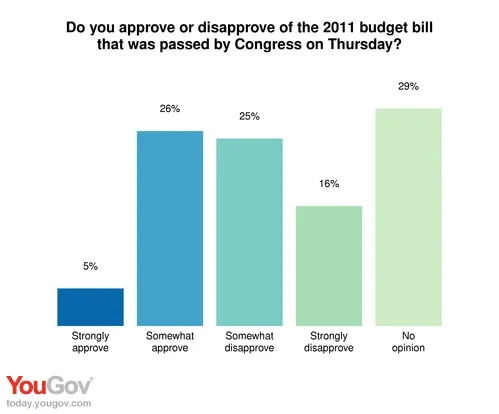
But Americans of all political beliefs are concerned about the nation’s budget deficit — and they also come together in their negative assessment of last week’s budget bill. Both Republicans and Democrats disapprove of the bill. Overall, just 31% of Americans approve of the bill, 41% disapprove. The measure, passed with bipartisan support, gets the approval of just over a third of both Republicans and Democrats. 43% of Republicans and 38% of Democrats disapprove. As for Tea Party identifiers, nearly twice as many disapprove as approve.
There is little trust in any Congressional party to make the right decisions about the deficit: nearly half have little or no confidence in the Republicans in Congress and their Democratic counterparts. President Obama fares marginally — but only marginally — better.
But, just as members of Congress have struggled to find cuts in government spending, Americans also find it difficult to come up with spending cuts they support — even as 73% of them (and even a majority of Democrats) believe the government should be spending less. Given a list of sixteen programs, a majority chose only one to cut — 73% said that spending should be decreased on foreign aid, which makes up only about 1% of the total budget. Relatively few would reduce spending on the entitlement programs that make up substantially more of the government’s expenditures: 12% would spend less on Social Security, 16% would cut Medicare spending. And when it comes to spending on education, a plurality (42%) would spend more.
Do you think federal spending on the following programs should be increased or decreased?
| Increase | Keep the same | Decrease | Not sure | |
|---|---|---|---|---|
Social Security | 29% | 51% | 12% | 8% |
National Defense | 16% | 42% | 36% | 6% |
Medicare | 26% | 51% | 16% | 7% |
Aid to the Poor | 22% | 45% | 25% | 8% |
Medicaid | 22% | 49% | 23% | 6% |
Veterans' Benefits | 33% | 54% | 6% | 6% |
Health research | 29% | 47% | 18% | 7% |
Education | 42% | 34% | 20% | 5% |
Highways | 26% | 52% | 15% | 7% |
Mass Transit | 25% | 36% | 30% | 9% |
Foreign Aid | 4% | 17% | 73% | 7% |
Unemployment benefits | 15% | 51% | 27% | 6% |
Science and Technology | 28% | 45% | 19% | 8% |
Agriculture | 12% | 41% | 38% | 9% |
Housing | 14% | 39% | 38% | 9% |
The Environment | 24% | 37% | 33% | 7% |
Republicans in general and Tea Party identifiers in particular are more willing to make cuts. Majorities of Tea Party identifiers would decrease spending for the environment, housing, agriculture, unemployment benefits, and mass transit, as well as on foreign aid. 40% of more would support decreases in aid to the poor and education.
There is limited support nationally for some other proposals to increase revenue or reduce spending. While 66% would stop the Congressional practice of adding special projects, or “earmarks,” to bills, only 42% would reduce farm subsidies. Fewer would charge admission to national monuments and museums in Washington, place a sales tax on sweetened beverages, eliminate the NASA manned space flight program, or raise the age for full Social Security benefits from 67 to 70. Tea Party identifiers are more likely to support most of these measures, but they are less likely to favor a tax on sweetened beverages.
Here are some proposals to increase government revenue or decrease government spending. Do you favor or oppose...
| Support | Neither support, nor oppose | Oppose | Not sure | |
|---|---|---|---|---|
Charging admission to federal monuments and museums in Washington, DC | 41% | 20% | 32% | 6% |
Imposing a sales tax on soda and other sweetened beverages | 37% | 17% | 40% | 5% |
Raising the Social Security retirement age from 67 to 70 | 28% | 15% | 51% | 5% |
Eliminating the practice of lawmakers | 66% | 11% | 14% | 9% |
Eliminating farm subsidies | 42% | 18% | 29% | 11% |
Eliminating NASA's human flight program | 26% | 26% | 41% | 7% |
And while raising taxes to increase revenue may be an option for some, most Americans would limit the increase to only the wealthy. Offered four approaches, six in ten favor raising taxes, but nearly all of those say it should only be on the wealthy. And while most want to cut spending in general, just one in four would include reducing benefits for individuals (like Social Security and Medicare) in those cuts.
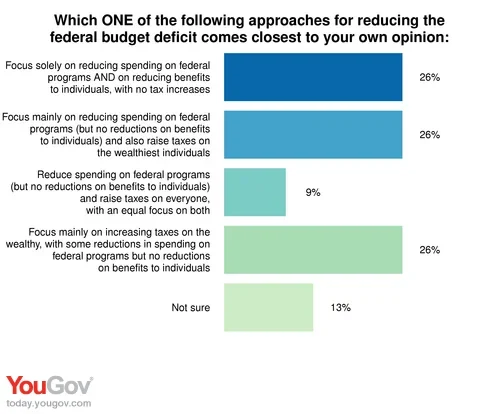
Half of those with family incomes of $100,000 or more would increase taxes on the wealthy; more than six in ten Tea Party identifiers are willing to cut both spending in general and spending on individual benefits. Only a quarter of them would increase anyone’s taxes.
As for eliminating the Bush tax cuts, while most Americans would let those for the wealthy expire, Republicans (and Tea Partiers) would keep them all.
When Congress negotiates on the budget, Americans would like to see compromise — 66% want that. However, about a third want lawmakers to fight for their priorities, even if that risks a government shutdown.
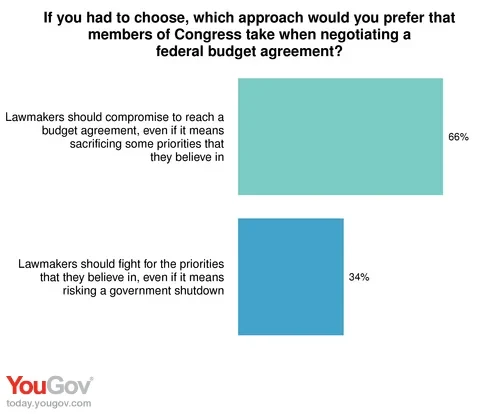
Republicans are closely divided on this question; 54% of them and nearly two-thirds of Tea Party identifiers would risk a government shutdown.
Photo source: flickr ( anitakhart )


