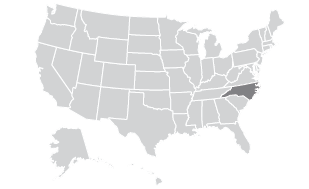

North Carolina
Democratic President Barack Obama is tied with Republican challenger Mitt Romney in North Carolina, 46% Obama to 46% Romney, in a poll of 1,161 voters statewide, conducted by YouGov.
| In North Carolina: |
|---|
Partisan loyalty is strong on both sides, as 92% of Democrats are sticking with Obama and 91% of Republicans are voting for Romney. |
Independents favor Romney over Obama 54%-33%. |
Women favor Obama over Romney by 53%-39%, while men favor Romney 54%-39%. |
Obama leads in the Raleigh-Durham Triangle region (59%-36%), in Charlotte, Obama leads by 50%-44% over Romney. |
Romney leads in West North Carolina (53%-33%), and leads 51%-43% in East North Carolina. |
Obama and Romney are close in the Piedmont/Central North Carolina region, as Obama leads by a nominal margin, 47%-46%. |
The youngest under age 30 favor Obama (66%-24%). The oldest voters age 65+ favor Romney (68%-29%). |
Republican Pat McCrory holds a 48%-32% lead over Democrat Walter Dalton in the race for Governor.
Voters in North Carolina are leaning in favor of voting for Republican candidates for the U.S. House, with 41% intending to vote for the Republican candidate for the House in their district, and 37% for the Democrat. The poll was conducted online September 7-14, 2012.
Sampling method: Respondents were selected from YouGov’s panel using sample matching. A random sample (stratified by age, gender, race, education, and region) was selected from the 2005–2007 American Community Study. Voter registration, turnout, religion, news interest, minor party identification, and non-placement on an ideology scale, were imputed from the 2008 Current Population Survey Registration and Voting supplement and the Pew Religion in American Life Survey. Matching respondents were selected from the YouGov panel, an opt-in Internet panel.
Weighting: The sample was weighted using propensity scores based on age, gender, race, education, news interest, voter registration, and non-placement on an ideology scale.
Number of respondents: 1,161 registered voters statewide.
Margin of error ± 3.3% (adjusted for weighting).
Click here for a complete report of results