There’s been a lot of speculation recently about how the remaining undecided voters will break over the next few days. My co-author on THE GAMBLE, John Sides, writes that his analyses of currently undecided voters using our Cooperative Campaign Analysis Data (C.C.A.P.) from the last 3 weeks predicts a break of 55-45 for Obama, which he concludes is evenly split because of the uncertainty associated with the estimate (margin of error of roughly 10-points).
Even with the sampling noise in our data and other associated uncertainties (is the model appropriately capturing all the drivers of choice? Who will really turn out and vote?), 55-45 is still the best guess from these data about the likely split – it’s either that or there’s too much noise to say much of anything at all. In other words, the absence of evidence for a large break for one of the candidates is not the same thing as evidence of no break.
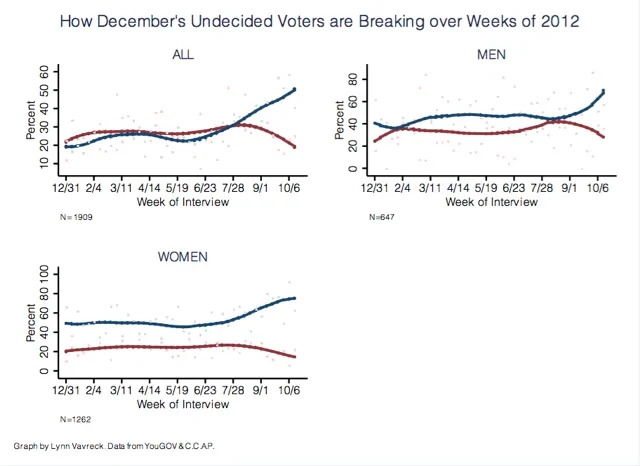
Here’s another way to look at this question, which is the way I’ve been tracking it for the last several weeks on CAMPAIGN STOPS at the New York Times. We know who among our respondents was undecided in December of 2011 and we re-interviewed these people again in 2012. We don’t know when they made up their minds, but many of them have over the last 42 weeks. Simple question: How have the December 2011 undecided voters been breaking? And, has the pattern changed in the last few weeks?
I present these trends graphically (see below) for the entire set of originally undecided voters who have now made a choice and for men and women separately. There are some notable patterns. Women initially undecided voters have always been breaking for Obama and are increasingly doing so since the conventions. There is not a lot of evidence that this trend is changing post-debates. Men have waffled between breaking for Romney and Obama, but similar to women, began to break more heavily for Obama after the conventions. The smoothing doesn’t show a strong narrowing of Obama’s lead among men, but some movement in the raw data might suggest men are choosing Obama less now than they were in September; but still in greater numbers than they are choosing Romney.
Some people are newly undecided (about half of the total set of undecided voters at any point in time has moved off of their choice into undecided). These newly undecided are coming nearly equally from both candidates over the weeks of 2012.
If the remaining undecided voters look at all like those who were initially undecided and moved to a vote choice over the year, they are likely to conform to these patterns. But, they may not be similar enough to these initially undecided voters to warrant that assumption. With seven days to go, for example, people who are still unsure about their choice run a good chance of staying home on election day. The question is will those who do go to the polls look similar to the undecided voters who have previously chosen a side? If they do, it’s good news for Obama, although at this point, the share of the electorate that is undecided is dwindling quickly!


