
Americans are far more likely to think other people drive too much than to think they do. They rate walking highly: It's enjoyable, safe, cheap, and with a positive environmental impact, according to majorities of Americans. It's hard to beat riding in a car as a passenger for looking at the world passing you by or talking to the people with you. But on public transportation, majorities say it's OK to sleep or strike up a conversation with a stranger; it's generally not OK to vape, play music without headphones, and eat food with a strong smell.
Those are some of the findings from a recent YouGov poll asking Americans about their transportation habits, including the kinds of transportation they use, what they do while using each kind of transportation, and their opinions of Americans’ driving habits.
Driving is the form of transportation most commonly used at least weekly by Americans (65%), followed among the forms included in the poll by walking (44%) and riding as a passenger in a car (35%). Americans think walking (93%) and riding a bike or scooter (93%) are the most enjoyable forms of transportation. These methods are also seen as more affordable and better for the environment than other transportation methods.
Americans’ driving habits
Most Americans (74%) own or lease a car, and 59% of all Americans think they drive a car about the right amount; 17% think they do not drive a car often enough, and slightly fewer (15%) think they drive too often. Younger adults are more likely than older ones to think they drive too often. While only 5% of those 65 or older think they drive too often, 21% of 18- to 29-year-olds and 26% of 30- to 44-year-olds say the same about themselves.
The share of Americans who think that Americans in general drive cars too often (45%) is much higher than the share who say they personally drive too often (15%). Another 42% think Americans drive the right amount, and only 5% think Americans do not drive often enough.
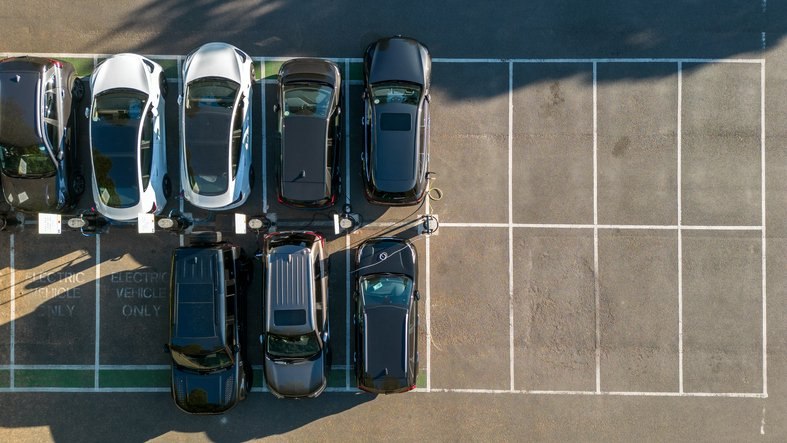
Most Americans think finding a place to park a car is very or somewhat easy (67%) in their community, while 27% think parking is very or somewhat difficult to find. White Americans (71%) are more likely than Black (56%) and Hispanic (62%) Americans to think parking is easy to find in their community.
A majority of Americans also think that parking is affordable in their communities: 63% think it is very or somewhat cheap and only 21% think it is very or somewhat expensive. As with finding a place to park, white Americans are also especially likely to say parking near them is cheap. While 67% of white Americans say parking in their community is cheap, only 56% of Black Americans and 52% of Hispanic Americans say the same.
Which forms of transportation do Americans use?
YouGov asked Americans which of eight forms of transportation they use at least once a week and at least once a month. Of the eight transportation methods, Americans are most likely to drive themselves in their car or other vehicle weekly (65%) and monthly (70%). About half of Americans report walking (56%) and riding as a passenger in a car (50%) at least once a month.
Other methods of transportation are used much less often. Only 11% of Americans ride a bus at least once per week, while 7% ride a bike or scooter, and 6% ride a train. Almost no Americans ride on an airplane or boat weekly or monthly.
There are substantial differences in transportation use habits based on where Americans live. Only 58% of Americans who live in cities drive monthly, compared to 77% of Americans from suburban areas. On the other hand, city dwellers are much more likely to walk (64%) and ride the bus (30%) monthly than Americans who live in suburban areas (43% and 6%), towns (35% and 8%), and rural areas (36% and 5%). Americans living in rural areas (1%) are much less likely than Americans from suburban areas (8%), towns (10%), and cities (16%) to ride a train at least once a month.
Despite these large differences in transportation usage, majorities of Americans who use them find enjoyable each of the five transportation methods included in the poll with enough monthly users for a meaningful measurement. Americans who use each method of transportation are most likely to think walking (93%), riding a bike or scooter (93%), and driving (89%) are very or somewhat enjoyable.
Americans are least likely to enjoy riding on buses. About one-quarter (23%) who ride the bus at least once a month think riding on a bus is not at all or not very enjoyable.
While Americans think walking and biking are both enjoyable, many more Americans see walking as safe than do biking. Compared to other methods of transportation in their local areas, 77% of Americans think walking is very or somewhat safe, while only 51% say the same about riding a bike or scooter. 74% of Americans think driving is safe relative to other transportation methods, while about half see riding on a bus (56%) or a train (50%) as safe.
Majorities of Americans think walking (73%) and riding a bike or scooter (60%) have a more positive impact on the environment than do other methods of transportation. Nearly half of Americans (46%) think driving has about the same environmental impact as other forms of transportation, while 30% think driving has a more negative environmental impact.
Americans also think that driving has a high (38%) or moderate (50%) cost compared to other methods of transportation. Meanwhile, majorities say walking and riding a bike or scooter are low-cost methods of transportation. 40% of Americans Americans say riding on a train has a moderate cost, and 36% say the same about riding on a bus.
How do Americans behave while using transportation?
YouGov also asked Americans about the actions they regularly perform on common kinds of transportation. When driving, 72% of Americans listen to music, 50% look at their surroundings, 41% talk to people with them in the car, and 39% think or reflect. Americans riding as passengers in a car are much more likely to talk to others in the car (71%) and look at their surroundings (64%) than are those driving a car — with talking more common likely in large part because passengers are (almost) always riding with others, and that isn't the case for drivers.
Americans riding as a passenger in a car or riding on a bus are much more likely to send text messages than are those while walking, driving a car, or riding a bike or scooter. Listening to radio, podcasts, or audiobooks is most common while driving (37%) and least common while riding a bike or scooter (12%). Using apps or websites is very uncommon while driving (2%) and biking (4%) and much more common while riding in a bus (29%) or car (32%).
The poll also asked Americans which behaviors they think are appropriate or inappropriate for people riding on public transportation such as buses and trains. Most Americans think using a laptop (72%), starting a conversation with strangers (64%), and sleeping (59%) are always or usually appropriate on public transportation. About half (48%) think bringing a bike or scooter is appropriate, but 32% think it is always or usually inappropriate.
Large majorities of Americans think it is always or usually inappropriate to violate priority seating rules (81%), talking on speakerphone (79%), playing music without headphones (77%), and taking photos of other passengers (77%) on public transportation. Taking up extra seats with personal belongings is also seen as inappropriate by most Americans (74%), but 16% disagree and see the behavior as appropriate.
— Carl Bialik and Taylor Orth contributed to this article
See the results for this YouGov poll
Methodology: This poll was conducted online on November 17 - 20, 2023 among 1,000 U.S. adult citizens. Respondents were selected from YouGov’s opt-in panel using sample matching. A random sample (stratified by gender, age, race, education, geographic region, and voter registration) was selected from the 2019 American Community Survey. The sample was weighted according to gender, age, race, education, 2020 election turnout and presidential vote, baseline party identification, and current voter registration status. Demographic weighting targets come from the 2019 American Community Survey. Baseline party identification is the respondent’s most recent answer given prior to November 1, 2022, and is weighted to the estimated distribution at that time (33% Democratic, 31% Republican). The margin of error for the overall sample is approximately 4%.
Image: Getty