
While some fashion is always in style, most looks are fleeting trends. A recent YouGov poll of 2,000 Americans measured opinion about 40 styles — worn by themselves or others. The styles range from miniskirts and tube tops to overalls and trucker hats. Opinions on these forms of fashion vary widely, including sometimes sharp differences between men and women as well as between older and younger adults.
The most- and least-liked fashion trends
Of the 40 trends asked about, about half were more likely to be loved or liked than hated or disliked by Americans; the other half were viewed more negatively than positively.
Topping the list of trends that Americans are most likely to have a positive opinion of are two of the most casual items on the list: flannel shirts and graphic tees. Some casual styles that are more liked than disliked include leggings and athleisure. Other highly rated items are dressier, including miniskirts and maxi skirts.
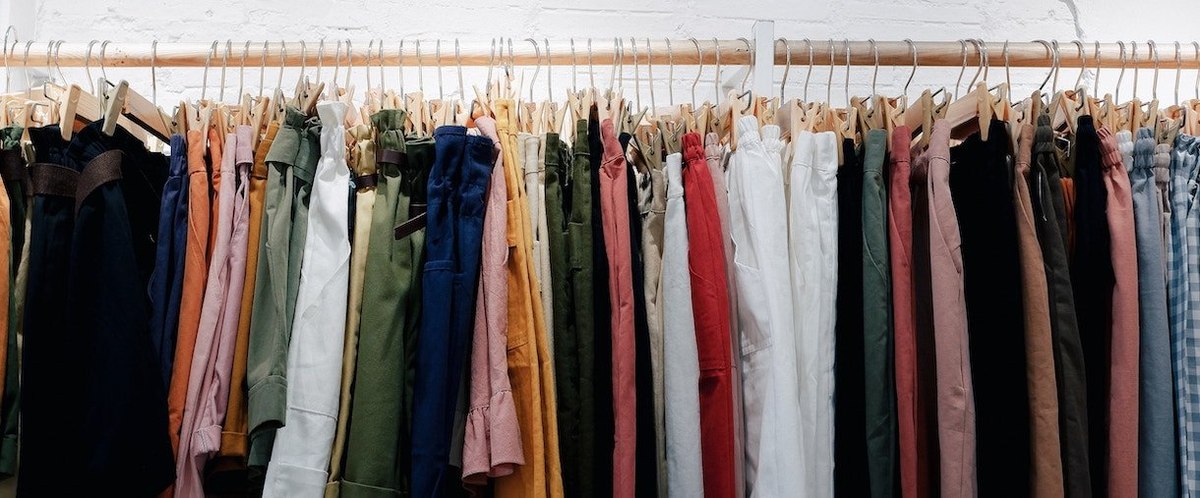
When it comes to pants, Americans generally have more positive opinions of cargo pants, bootcut pants, and bell bottoms than of skinny or ripped jeans, high-waisted pants, or wide-leg pants. Sagging pants and parachute pants are loved or liked less than any of the other styles polled. More Black Americans than white Americans love or like parachute pants and sagging pants, though opinion of both fashions still is more negative than positive among Black Americans.
On the shoe front, Americans are widely positive on knee-high boots. There is more division when it comes to Ugg boots and Crocs. Platform shoes, socks with sandals, and metallic footwear are all viewed more unfavorably than favorably. The survey also asked Americans how closely they follow recent fashion trends. Just 8% say they follow trends very closely, while 23% say somewhat closely, 35% say not very closely, and 34% say not at all.
People who say they follow trends very or somewhat closely are more likely than those who don't to love or like most of the 40 trends asked about. Compared to others, fashion-forward Americans are especially likely to have favorable opinions of platform shoes, Ugg boots, and ripped jeans. Flannel shirts is the only style asked about that people who follow fashion trends at least somewhat closely are less likely than others to have a positive view about. And there is no difference on cargo pants.
Gender also divides American opinion on fashion. Women are more likely than men to have favorable views of most of the styles asked about, though there are exceptions. Men are 27 percentage points more likely than women to say they love or like miniskirts. They are also somewhat more likely than women to approve of other more revealing trends, including sheer clothing, tube tops, and crop tops. Women are far more likely than men, on the other hand, to say they love or like maxi skirts, leggings, and high-waisted pants.
Younger American adults are more likely than older Americans to have favorable views of most fashion trends included on the poll. Ripped jeans, high-waisted pants, and skinny jeans are all more popular with adults under 45 than with older age groups; the gap is especially large compared to Americans 65 and older. Flannel shirts, bootcut pants, bomber jackets, and cargo pants are viewed more positively by Americans 45 and older than those younger.
Polling on patterns
The survey also asked Americans their views on 20 patterns commonly used in fashion. Plaid is loved or liked by the most Americans among these 20 patterns, followed by pinstripe and tie-dye. Among the least liked patterns are animal prints, including cow, zebra, tiger, and cheetah prints.
— Carl Bialik contributed to this article
See the results for this YouGov poll
Methodology: The poll was conducted among 2,000 U.S. adult citizens on two separate surveys from September 26 - 30, 2023 and September 27 - October 2, 2023, with each survey taken by 1,000 U.S. adult citizens. Respondents were selected from YouGov’s opt-in panel using sample matching. A random sample (stratified by gender, age, race, education, geographic region, and voter registration) was selected from the 2019 American Community Survey. The sample was weighted according to gender, age, race, education, 2020 election turnout and presidential vote, baseline party identification, and current voter registration status. Demographic weighting targets come from the 2019 American Community Survey. Baseline party identification is the respondent’s most recent answer given prior to November 1, 2022, and is weighted to the estimated distribution at that time (33% Democratic, 31% Republican). The margin of error for the overall sample is approximately 2%.
Image: Unsplash (Lucas Hoang)