

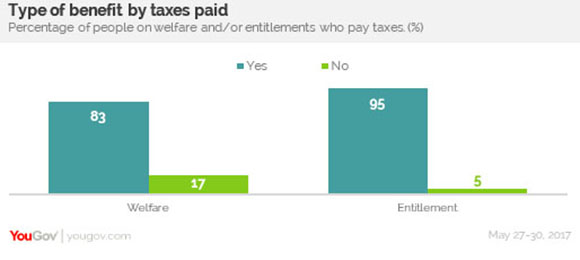
83% of people on welfare pay taxes
Budgeting assessments often come down to who pays and who benefits. Many Americans currently benefit from government programs, though even more pay taxes. In the latest Economist/YouGov Poll, many of the beneficiaries and the taxpayers are one and the same.
89% of Americans adults pay some kind of taxes. And most (55%) receive some sort of benefit. The most common benefits are the ones that the vast majority of senior citizens receive: Medicare and Social Security. Because of these entitlement programs, benefit recipients are as likely as those not receiving benefits to be paying taxes. The most common tax people know they pay? A state’s sales tax.
Even those receiving benefits that can be categorized as welfare, including food stamps, public housing and Medicaid. More than eight in ten of those receiving welfare type benefits pay some kind of tax.
Medicaid and food stamps are the most-received welfare benefits, as more than half of those who receives any welfare-type of benefit (which also includes Emergency Food Assistance, and Supplemental Security Income) are covered by Medicaid or receive food stamps.
There are some who receive both entitlements benefits and welfare-style benefits. One in five of those receiving Medicare, Social Security or unemployment benefits also get food stamps.
Benefits cross party lines: just about the same proportion of Republicans as Democrats receives the entitlements of Social Security and Medicare, and Democrats are only a little more likely to get welfare benefits than Republicans. 34% of self-identified Democrats receive some welfare benefit, compared with 24% of Republicans.
There are few differences in all these groups in how they perceive the President’s budget. Of course, many in all groups have heard little or nothing about it (that’s especially true among those in the small group who pay no taxes, nearly half of whom have heard nothing at all about the budget proposal).
All recipient and paying groups see it negatively and are more likely to oppose it than support it. More than three times as many say it will hurt them than think it will help. And they are all more likely to think it will increase – not decrease – their taxes.