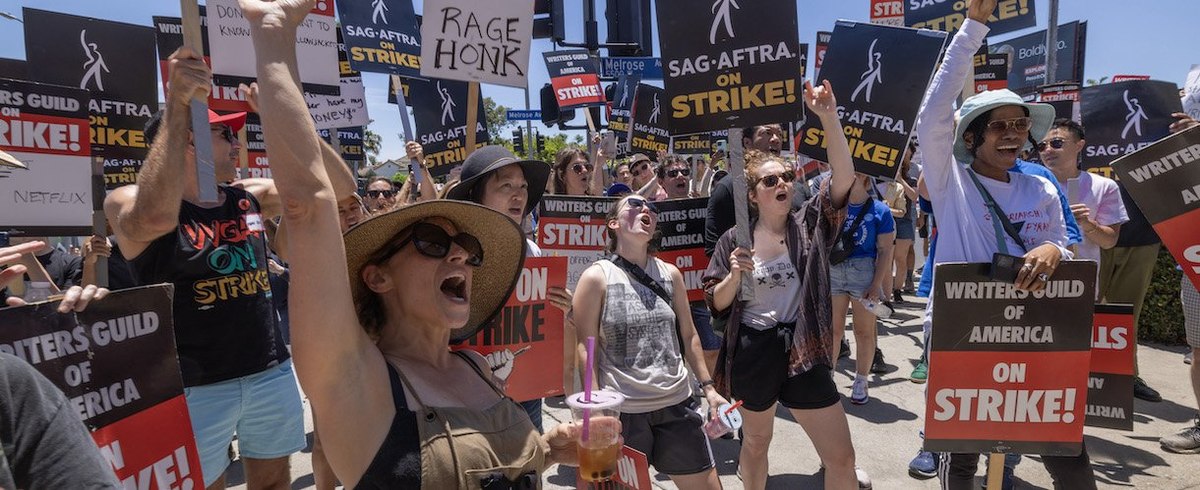


The latest Economist/YouGov poll finds that recent strikes by writers and actors for movies and television are supported by most American adults, as well as majorities among some groups that generally are more likely to view unions negatively than positively. The strikes by the Writers Guild of America (WGA) and the Screen Actors Guild (SAG-AFTRA) each are strongly or somewhat supported by three times as many Americans as the shares who strongly or somewhat oppose them. While Democrats are far more likely than Republicans to support the strikes, Republicans are likelier to support than oppose them.
By 51% to 27%, Americans overall have a favorable opinion of labor unions. More believe unions have increased their influence in the last year (23%) than say their influence has become less strong (16%). About one in four (27%) expect union influence to increase in the next year; 16% think it will decrease. Democrats are more likely to hold favorable (73%) than unfavorable (8%) views of unions in general; among Republicans, those figures are 35% and 48%. But more Republicans support than oppose both Hollywood strikes — the writers' strike by a bigger margin than the actors’ strike. Democrats are far more likely than Republicans to support each strike.
Republicans also are less likely than Democrats to hold favorable views of many other types of unions, including unions for freight and warehouse workers, registered nurses, airline pilots, and public school teachers. The only type of union that Democrats and Republicans hold similar views on is police unions; majorities of Democrats and Republicans view police unions favorably.
See the toplines and crosstabs from the Economist/YouGov poll conducted on July 22 - 25, 2023 among 1,500 U.S. adult citizens.
Methodology: Respondents were selected from YouGov’s opt-in panel using sample matching. A random sample (stratified by gender, age, race, education, geographic region, and voter registration) was selected from the 2019 American Community Survey. The sample was weighted according to gender, age, race, education, 2020 election turnout and presidential vote, baseline party identification, and current voter registration status. Demographic weighting targets come from the 2019 American Community Survey. Baseline party identification is the respondent’s most recent answer given prior to November 1, 2022, and is weighted to the estimated distribution at that time (33% Democratic, 31% Republican). The margin of error for the overall sample is approximately 3%.
Image: Getty (David McNew/Stringer)