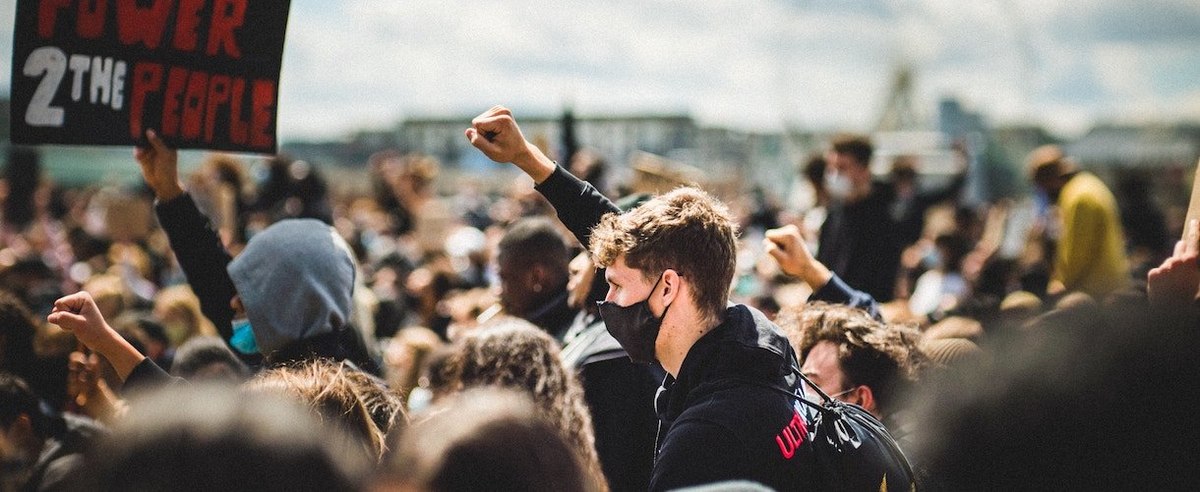
While nearly all Americans find some protest tactics to be acceptable, other forms of protest are seen as unacceptable by large majorities, a new YouGov survey finds.
At least three-quarters of Americans consider it to be always or usually acceptable to protest by creating a petition (87%), calling your representative (85%), handing out flyers (85%), chanting or singing (82%), boycotting products (80%), marching for long distances (79%), or wearing symbolic clothing or accessories (78%).
Tactics that involve more direct or invasive action — including blocking traffic (12%), disrupting public events (21%), and occupying spaces or buildings (36%) — are less likely to be considered acceptable. Intentionally destructive actions — rioting (9%), defacing property (9%), and burning the American flag (17%) — are among the least accepted protest actions.
The forms of protest included in the poll that are most likely to be accepted by Americans overall — such as petition signing, handing out flyers, and calling your representatives — are generally slightly more likely to be considered always or usually acceptable by Republicans than by Democrats. But this pattern is reversed for the less widely accepted tactics: Democrats accept them far more than Republicans do.
In addition to opinions on protest tactics, the survey also asked who Americans think should be allowed to protest. For most of the 12 groups asked about, large majorities of Americans say it is always or usually acceptable to peacefully protest. This includes teachers (76%), athletes (75%) scientists (74%), religious leaders (73%), and journalists (69%). Majorities also consider it to be acceptable for elected officials (59%), police officers (57%), or military members (56%) to participate in protests that are peaceful. Slightly fewer — 46% — say the same of judges, and the smallest share (41%) think it is at least usually OK for young children to protest.
— Carl Bialik contributed to this article
See the results for this YouGov poll
Methodology: This poll was conducted online on September 21 - 25, 2023 among 1,000 U.S. adult citizens. Respondents were selected from YouGov’s opt-in panel using sample matching. A random sample (stratified by gender, age, race, education, geographic region, and voter registration) was selected from the 2019 American Community Survey. The sample was weighted according to gender, age, race, education, 2020 election turnout and presidential vote, baseline party identification, and current voter registration status. Demographic weighting targets come from the 2019 American Community Survey. Baseline party identification is the respondent’s most recent answer given prior to November 1, 2022, and is weighted to the estimated distribution at that time (33% Democratic, 31% Republican). The margin of error for the overall sample is approximately 4%.
Image: (Mika Baumeister)


