

This week’s Economist/YouGov poll covers…
- The continuing, slow recovery in Trump's job approval
- Expectations for the biggest winners and losers of the Trump budget
- An early look at the 2026 midterms
- The extent of acceptance of government monitoring of social media accounts
- Perceived race relations five years after George Floyd's death
- Which figures in their party Democrats consider to be their leader
- Summer expectations of hot days and cooling international tourism
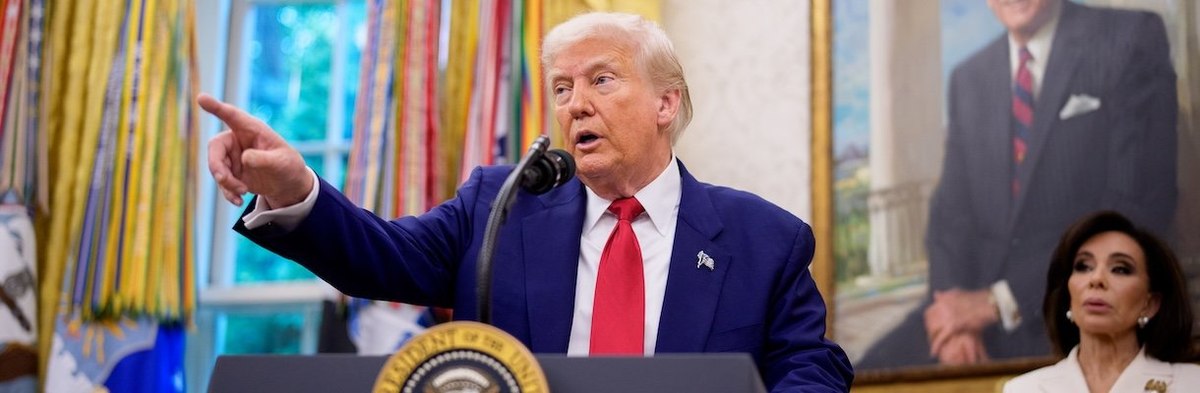
Trump's rising popularity
- For the first time in two months, less than half of U.S. adult citizens strongly or somewhat disapprove of how Donald Trump is handling his job as president
- More Americans still disapprove of Trump's job performance (49%) than strongly or somewhat approve (45%)
- But that represents an improvement from when Trump's job approval bottomed out in the April 19 - 22 Economist / YouGov Poll at 54% disapprove and 41% approve
- Trump's net job approval — the percentage who approve minus the percentage who disapprove — of -4 is 10 percentage points higher than it was at this point in his first term (-14), though it remains considerably below Joe Biden's net approval of +10 at this point in his term
- More Americans disapprove than approve of how Trump is handling jobs and the economy, and the same is true of his handling of inflation/prices, though his net approval on these issues has risen since April
- But Trump now has positive net approval on his handling of immigration — and crime, though it hasn't been asked about since mid-May
The federal budget
- 45% of Americans strongly or somewhat oppose Trump's budget plan, while 37% support it
- 44% of Americans expect the new budget will increase the deficit, while 19% think it will decrease the deficit and 15% think the deficit will remain the same
- More Americans think the budget will hurt the average American either a lot or a little than think it will help them (47% vs. 27%); by a slightly smaller margin, more think they and their family will be hurt than think they will be helped (41% vs. 24%)
- 37% think Trump's budget will increase their taxes, while 20% think their taxes will decrease and 23% think they will stay the same
- About half (51%) of Americans think the wealthy will benefit most from Trump's budget, while 21% say the middle class will and 6% think the poor will
- 40% think the poor will be hurt most by the budget proposal, compared to 14% who say the middle class will and 12% who say the wealthy will
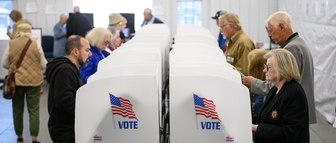
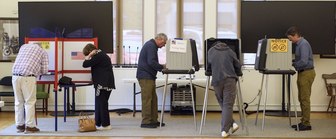
Battle for Congress
- Slightly more Americans say they would vote for a Democratic candidate than a Republican candidate if congressional elections were held today
- Among all U.S. adult citizens, 39% say they would vote for the Democrat and 36% for the Republican; 26% say that they are either not sure, would vote for another candidate, or would not vote
- Among registered voters, 44% would pick the Democrat and 42% the Republican
- Americans who voted in the 2024 presidential election favor Democratic congressional candidates by 1 point (44% vs. 43%), while Americans who didn't vote in 2024 favor Democrats by 9 percentage points (29% vs. 20%)
- Democrats lead by 3 points among Americans who voted in the 2022 midterm elections (46% vs. 43%)
- Americans who say they follow politics most of the time favor Democrats by 6 points (47% vs. 41%) while those who follow politics some of the time lean Republican by 3 points (36% vs. 39%) and those who follow politics only now and then favor Democrats by 10 points (38% vs. 28%)
- 36% of Americans think the Democratic Party will do better in the 2026 congressional elections, while 32% think the Republican Party will
- About three-quarters of both Democrats and Republicans expect their own party to do better
Universities and surveillance
- About half of Americans (51%) think universities in the U.S. are either the best in the world (14%) or better than in most countries (37%); 25% think they are about average and 13% say they are either the worst or worse than in most countries
- More Democrats than Republicans think U.S. universities are the best or better than in most countries (63% vs. 47%)
- More Americans want to increase than decrease federal funding for scientific research being done at universities in the U.S. (40% vs. 17%), while 28% want funding to stay the same
- Most Democrats (61%) want to increase university research funding. Republicans are more divided: 20% want an increase, 31% want a decrease, and 33% want funding to stay the same
- As the Trump administration pauses interviews with international students applying for visas, only 14% of Americans think having international students in the U.S. is very or somewhat bad for the country; far more — 56% — think it is good, while 20% think it is neither good nor bad
- Most Democrats (79%) think having international students in the country is good
- Republicans are split: 35% say it is good, 29% say it is bad, and 28% say it is neither good nor bad
- Young Republicans are more likely to see international students as beneficial to the U.S.: Republican adults under 45 are about twice as likely as older Republicans to say the students' effect is good (51% vs. 26%). Republicans 45 and older are more than three times as likely as younger Republican adults to say students' effect is bad (39% vs. 11%)
- Roughly half (53%) of Americans are OK with the government monitoring the social media accounts of people applying to immigrate to the U.S. — something the Trump administration is preparing to do; 27% say the administration should not do this and 19% are not sure
- But about two-thirds (68%) of Americans would not be OK with the U.S. government monitoring the social media accounts of Americans who are not being investigated for crimes; 17% say the government should be allowed and 15% are not sure
- Only 39% of Americans say they have a great deal or a fair amount of trust in the government to determine whether content on a person's social media account should disqualify them from immigrating to the U.S.; 45% say they don't trust the government very much or don't trust it at all
- Half (50%) of Republicans say the main goal of the government's decision to screen the social media accounts of certain immigrants applying for visas is to improve national security; 41% think that suppressing political dissent is also a goal — either the main goal (7%) or an equal goal to improving national security (34%)
- 40% of Democrats think the main goal is to suppress political dissent; 40% think improving national security is a goal, including 18% who say it is the main goal and 22% who say it is equal to suppressing political dissent
- 53% of Americans — including 75% of Democrats and 35% of Republicans — believe immigrants in the U.S. should have the same right to express political views online as U.S. citizens; 30% of Americans say they should not, including 13% of Democrats and 49% of Republicans
- 36% of Americans — including 43% of Democrats, 39% of Independents, and 25% of Republicans — say they don't generally feel free to speak their mind and voice their opinions in public without fear
- A similar question asked in 2022 found the opposite pattern: Roughly half of Republicans (52%) and Independents (48%) but only 32% of Democrats said they didn't feel free to speak their minds
Race relations and policing
- Last week marked the five-year anniversary of the death of George Floyd, and public opinion on his killing has changed significantly since just after its occurrence
- Today, 60% of Americans say that the police were not justified in the amount of force they used while arresting Floyd; 25% say their use of force was justified and 16% are not sure
- The vast majority of Democrats (88%) think the use of force against Floyd by police was not justified. Republicans are more divided: Slightly more say it was justified than unjustified (47% vs. 36%)
- Compared to an Economist/YouGov survey conducted a week after Floyd's death in May 2020, Americans are now 18 points more likely to say the force used against Floyd was justified and 26 points less likely to say it was unjustified
- Republicans are now 36 points more likely to view it as justified and 43 points less likely to view it as unjustified
- Democrats are 1 point more likely to say it was justified and 4 points less likely to say it was unjustified
- However, most of the shift isn't recent — the bulk of the drop in belief the use of force was unjustified occurred months after Floyd's death, sometime between June and September 2020
- By 62% to 25%, Americans strongly or somewhat approve of non-violent protests in response to the deaths of black citizens such as Floyd, Ahmaud Arbery, and Jacob Blake
- Today, there is more approval and less disapproval for the protests than there was when we last asked in November 2021; then, 56% approved and 32% disapproved. Republican approval has increased 15 points, to 44% from 29%
- Few see improvement in race relations since Floyd's death: 48% of Americans say that in the past five years, race relations in the U.S. have worsened, only 15% think they have gotten better, and 38% think they have stayed the same
- 61% of Americans view relations between minorities in America and the police as generally bad, while 39% view them as good
- Three-quarters (75%) of Democrats say relations are bad, while a smaller majority of Republicans (57%) say they are good and 43% say they are bad
Democrats and Republicans
- Americans don't have warm feelings about either Democrats or Republicans. YouGov asked Americans to rate their feelings toward each on a scale of 0 to 100, with zero meaning very unfavorable and 100 meaning very favorable. Overall, 27% of Americans rate their view of Democrats between 0 and 9, while 29% rate Republicans in that range
- While Democrats and Republicans generally rate members of their own party more positively, both groups are more likely to have very unfavorable responses to members of the other party than to have very favorable responses to their own party
- 21% of Democrats rate Democrats between 90 and 100, while 49% of Democrats rate Republicans between 0 and 9
- 21% of Republicans rate Republicans between 90 and 100, while 51% rate Democrats between 0 and 9
- Independents are far more likely to rate both Democrats and Republicans negatively than positively
- Rating Democrats, 23% of Independents score them between 0 and 9, while only 1% rate them between 90 and 100
- And rating Republicans, 29% of Independents give them scores between 0 and 9, while 3% rate them between 90 and 100
- Independents are most likely to give each party a middling score out of 100: 49% rate Democrats between 30 and 69 and 44% rate Republicans in that range
- Americans are more likely to say Democrats are the party of Black Americans, union members, and Hispanic Americans, and to say Republicans are the party of white Americans, the wealthy, and veterans
- Americans are closely divided about which party most represents the working class and the middle class
- Both Democrats and Republicans are more likely than not to say that Democrats are the party of Black Americans and that Republicans are the party of white Americans and the wealthy
- For union members, Hispanic Americans, the working class, the middle class, and veterans, members of each party are more likely to say their own party represents those groups
- There's no consensus among Democrats about who should lead the Democratic Party
- Out of a list of 13 prominent figures aligned with the Democratic Party, Democrats are most likely to say Barack Obama (21%) and Kamala Harris (21%) should be the party's leader
- Pete Buttigieg and Alexandria Ocasio-Cortez were the only other figures chosen by more than 5% of Democrats
- Moderate or conservative Democrats were most likely to pick Obama (25%) followed by Harris (15%), while Democrats who identify as liberal — but not very liberal — were most likely to pick Harris (24%) followed by Obama (21%). Very liberal Democrats were also most likely to pick Harris (26%), while 21% picked Ocasio-Cortez; only 10% picked Obama
Elon Musk
- Two-thirds of Americans (68%) think Elon Musk will have at least some influence within Trump's administration going forward
- Only 38% say they would like for Musk to have any influence
Summer expectations
- Democrats and Republicans have very different expectations of heat and tourism this summer
- Overall, more Americans expect that tourism to the U.S. will be much or somewhat lower than usual this summer than think tourism will be higher (49% vs. 18%); 22% think it will be about the same
- About twice as many Democrats as Republicans think that tourism to the U.S. will be lower than usual this summer (64% vs. 33%)
- More Americans also expect that compared to past summers, this summer in their local area will be hotter than expect it to be cooler (51% vs. 8%)
- Opinion on this, too, differs by party: Democrats are about twice as likely as Republicans to expect a hotter-than-usual summer (70% vs. 36%)
- Most people (72%) who expect a hotter-than-usual summer think that the higher temperatures they expect would be due to climate change; 86% of Democrats and 54% of Republicans who expect above-average summer temperatures would attribute them to climate change
- 44% of Americans say they plan on traveling this summer, including 11% who plan to travel outside the U.S.
- 60% say that gas prices will affect their summer travel plans either a lot or a little, and 53% say the same about airline ticket prices
- Democrats are about as likely as Republicans to say that gas prices will affect their summer travel plans (60% vs. 57%), which marks a shift since last June. Compared to then, the share of Republicans saying gas prices will have an effect on their summer travel has fallen 16 points; Democrats' expectations have not changed significantly
— Carl Bialik contributed to this article
Throughout this report, some numbers may appear to be off by 1 because of rounding
See the toplines and crosstabs for the May 30 - June 2, 2025 Economist/YouGov Poll
Methodology: The poll was conducted among 1,610 U.S. adult citizens. Respondents were selected from YouGov’s opt-in panel to be representative of U.S. adult citizens. A random sample (stratified by gender, age, race, education, geographic region, and voter registration) was selected from the 2019 American Community Survey. The sample was weighted according to gender, age, race, education, 2024 presidential vote, 2020 election turnout and presidential vote, baseline party identification, and current voter registration status. 2024 presidential vote, at time of weighting, was estimated to be 48% Harris and 50% Trump. Demographic weighting targets come from the 2019 American Community Survey. Baseline party identification is the respondent’s most recent answer given around November 8, 2024, and is weighted to the estimated distribution at that time (31% Democratic, 32% Republican). The margin of error for the overall sample is approximately 3%.
Image: Getty (Andrew Harnik / Staff)
What do you really think about President Trump, American politics in general, and everything else? Share your reality, join the YouGov panel, and get paid to share your thoughts. Sign up here.