This week’s Economist/YouGov poll covers…
- Widespread dislike of congressional Democrats
- Americans' perception of others' patriotism and their own
- What people plan to do on July 4
- Views of the last two presidential elections and Jan. 6
Democrats turn on their congressional caucuses
- Americans view congressional Democrats as unfavorably as they ever have in any polls in the past four years. 30% of Americans have a very or somewhat favorable view of Democrats in Congress, while 62% have a very or somewhat unfavorable view
- Republicans dislike congressional Democrats about as much as they have for years: 7% have a favorable opinion and 89% have an unfavorable opinion
- Democrats hold an overall favorable view of Democrats in Congress; 66% are favorable and 27% are unfavorable, amounting to a net favorability of +39
- But this is down sharply from October 2024, when Democrats controlled the U.S. Senate, and 85% of Democratic U.S. adult citizens viewed congressional Democrats favorably and 6% viewed them unfavorably (+75)
- For almost all of President Joe Biden's term in office, Democrats viewed their congressional party more favorably than Republicans viewed theirs
- That has ended since the November election, when Republicans took control of the presidency and both of the U.S. House and U.S. Senate. Now Republicans have a more favorable view of their representatives in Congress than Democrats do of theirs
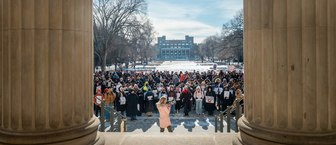
Fourth of July
- Three-quarters of Americans consider themselves either very (37%) or somewhat (38%) patriotic; more Republicans than Democrats say they are very patriotic (54% vs. 27%)
- Americans' perceptions of their fellow Americans' patriotism are lower than Americans' assessment of their own: 13% think that most Americans are very patriotic, while 65% say they are somewhat patriotic
- Slightly fewer, though, describe most Americans as not very or not at all patriotic than describe themselves that way (22% vs. 25%)
- Many Americans (44%) believe that the country is becoming less patriotic, while 14% think it is becoming more patriotic and 43% think it has stayed about the same
- About half of Americans (51%) have an American flag at home. This includes 68% of Republicans and 37% of Democrats
- Around one-quarter (23%) of Americans say they display an American flag at their home every day, including far more Republicans (38%) than Democrats (11%)
- Most Americans (57%) correctly think that Republicans are more likely to display an American flag than say Democrats are more likely to; 4% think Democrats are more likely to and 28% think members of each party are equally likely to
- 70% of Americans say that flying an American flag is an act of patriotism. On this, too, Democrats and Republicans differ: 89% of Republicans say flying a flag is an act of patriotism, compared to 58% of Democrats
- What do Americans plan to do on the Fourth of July weekend? 45% plan to stay home and relax, 35% will attend a family get-together, 32% will attend a cookout, barbecue, or picnic, and 31% will watch TV (excluding sports)
- Most Americans (81%) say they enjoy fireworks, and 23% say they plan to watch them this Fourth of July weekend. 15% say they will attend a professional fireworks display and 11% will light their own fireworks (3% say both)
Political division and violence
- 58% of Americans think that political violence is a major problem in the United States; 30% think it is a minor problem and 4% think it is not a problem
- Most Republicans (72%) believe that Joe Biden was not the legitimate winner of the 2020 election. Roughly half as many Democrats (38%) say the same about Trump's win in 2024
- Twice as many Americans describe their views on what took place at the U.S. Capitol on January 6, 2021 as people participating in "a violent insurrection" as describe it as people participating in "legitimate political discourse" (55% vs. 27%)
- Most Democrats (89%) see January 6 as a violent insurrection
- Republicans are more divided: 26% say it was a violent insurrection and 51% say it was legitimate political discourse
- Most Americans (80%) have heard about the murders of Minnesota State Representative Melissa Hortman and her husband and the attempted murders of Minnesota State Senator John Hoffman and his wife. More Democrats than Republicans say they have heard "a lot" about these attacks on Democratic lawmakers and their spouses (48% vs. 27%)
- About two-thirds (65%) of Americans think the attacks in Minnesota represent a broader problem in American society, while 14% say they were an isolated event
- By comparison, somewhat fewer (56%) say that the attempted assassination of Trump last July was indicative of a broader problem in society; 30% say it was an isolated event
- A majority (58%) believe the attacks on Minnesota legislators were motivated by political beliefs; 18% think they were motivated by something else. Far more Democrats than Republicans see them as politically motivated (71% vs. 49%)
- Compared to the Minnesota attacks, fewer (48%) believe that Trump's assassination attempt was motivated by political beliefs; 31% think it was motivated by something else
— Carl Bialik contributed to this article
Throughout this report, some numbers may appear to be off by 1 because of rounding
See the toplines and crosstabs for the June 27 - 30, 2025 Economist/YouGov Poll
Methodology: The poll was conducted among 1,648 U.S. adult citizens. Respondents were selected from YouGov’s opt-in panel to be representative of U.S. adult citizens. A random sample (stratified by gender, age, race, education, geographic region, and voter registration) was selected from the 2019 American Community Survey. The sample was weighted according to gender, age, race, education, 2024 presidential vote, 2020 election turnout and presidential vote, baseline party identification, and current voter registration status. 2024 presidential vote, at time of weighting, was estimated to be 48% Harris and 50% Trump. Demographic weighting targets come from the 2019 American Community Survey. Baseline party identification is the respondent’s most recent answer given around November 8, 2024, and is weighted to the estimated distribution at that time (31% Democratic, 32% Republican). The margin of error for the overall sample is approximately 3.5%.
Image: Getty (Chip Somodevilla / Staff)
What do you really think about President Trump, American politics in general, and everything else? Share your reality, join the YouGov panel, and get paid to share your thoughts. Sign up here.