
Editor's note: This article was originally published in The Surveyor, YouGov America's email newsletter. It has been revised for publication here. Subscribe to The Surveyor for regular updates on YouGov's polling.
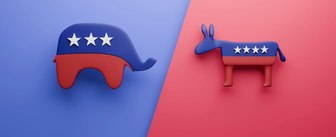
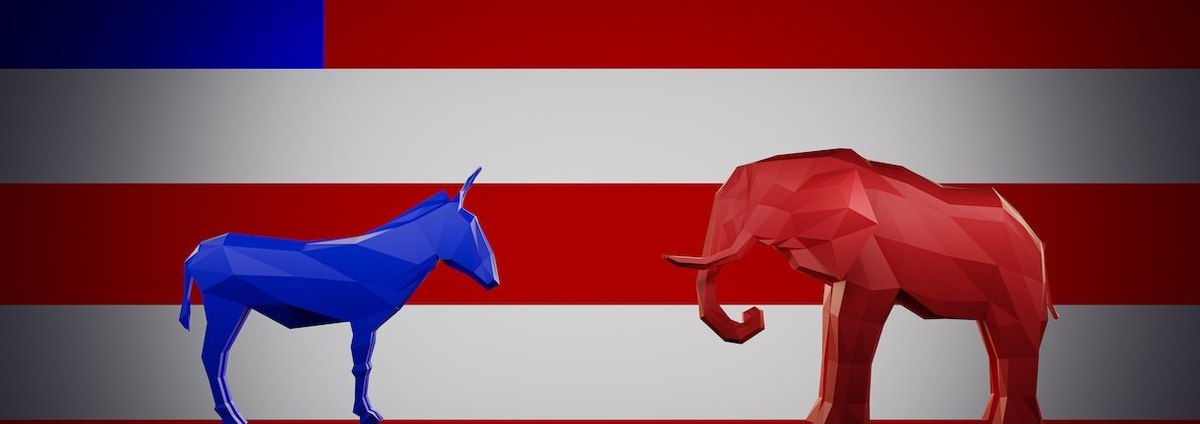
Unlike some countries, the Democratic and Republican parties in the U.S. aren't dues-paying membership organizations. So saying you're "a Democrat" or "a Republican" is more a matter of personal identity than anything else. And that's before we open up the can of worms that is the category "Independents."
YouGov follows a standard survey methodology for determining our respondents' party identification. First, we ask people, "Generally speaking, do you think of yourself as a ...?" and provide options of Democrat, Republican, Independent, "not sure," and "other."
At the most basic level, then, we have Democrats and Republicans, and then three other categories that YouGov often lumps together as "Independents" for sharing the characteristic of not identifying with either major party. These three groups are roughly the same size, which is helpful for when we use party identification as a crosstab for other questions:
But we don't stop there, for reasons that will become clear soon. Instead we ask a follow-up question that is based on people's answers to that first party ID question:
- Respondents who said they are a Democrat or a Republican are asked: "Would you call yourself a strong [Democrat/Republican] or a not very strong [Democrat/Republican]?"
- Generally speaking, a little less than two-thirds of Democrats and Republicans will each describe themselves as "strong" in their party identification, and a little more than one-third will describe themselves as "not very strong"
- Those who say they are an Independent, "other," or "not sure," are asked: "Do you think of yourself as closer to the Democratic or the Republican Party?
- About one-quarter of Independents will say they lean more toward each of the two major parties, making a total of about half of Independents who lean
- Nearly all of the other half of Independents say they don't lean toward either party; a small percentage say they aren't sure if they lean either way
Process all of that, and you end up with around 40% of Americans who are Democrats or Independents who lean to the Democratic Party, around 40% who are Republicans or Independents who lean to the Republican Party, and around 20% who are Independents who lean to neither party.
So with all this, we've got a few standard ways to break down the electorate.
Our most common is three-way party identity: Democrats, Independents, and Republicans. But there are other circumstances where it might make more sense to lump the Independents who lean toward one party in with that party.
Because here's something really important to know about American politics: On most issues, Independents who lean toward one party behave and believe almost exactly the same as members of that party.
Here's one quick example: How Americans with all of these detailed party identifications come down on Donald Trump's job approval, in the most recent Economist / YouGov Poll.
Most "strong Democrats" say they strongly disapprove of Donald Trump's job performance (93%), while "not very strong Democrats" are almost as likely to disapprove, but less likely to do so strongly (71%). The reverse is true for Republicans: Similar shares approve of Trump's job performance, but 68% of "strong Republicans" and 36% of "not very strong Republicans" say they strongly approve.
Things get even more interesting when looking at Independents. Independents who lean Democratic look identical to "strong Democrats" on this question, with 92% of these Democratic-leaning Independents strongly disapproving of Trump. Meanwhile Independents who lean Republican have similar Trump approval numbers to "not very strong Republicans," with 37% strongly approving of Trump and another 35% somewhat approving.
The Independents who lean to neither party are on the whole anti-Trump: 50% strongly disapprove and 15% somewhat disapprove, compared to 6% who strongly approve and 15% who somewhat approve. Additionally 15% of these non-leaners — who are sometimes called "true Independents" — aren't sure what they think about Trump's job performance, an option chosen by tiny shares of every other party identification.
This finding isn't unique to Trump's second term — the same pattern held for presidential job approval among Independents leaning toward and away from the president's party at this stage of Joe Biden's presidency.
Methodology: The poll was conducted among 1,549 U.S. adult citizens. Respondents were selected from YouGov’s opt-in panel to be representative of U.S. adult citizens. A random sample (stratified by gender, age, race, education, geographic region, and voter registration) was selected from the 2019 American Community Survey. The sample was weighted according to gender, age, race, education, geographic region, 2024 presidential vote, 2020 election turnout and presidential vote, baseline party identification, and current voter registration status. 2024 presidential vote, at time of weighting, was estimated to be 48% Harris and 50% Trump. Demographic weighting targets come from the 2019 American Community Survey. Baseline party identification is the respondent’s most recent answer given around November 8, 2024, and is weighted to the estimated distribution at that time (31% Democratic, 32% Republican). The margin of error for the overall sample is approximately 3.5%.
Image: Getty
What do you really think about President Trump, American politics in general, and everything else? Share your reality, join the YouGov panel, and get paid to share your thoughts. Sign up here.