

Many Americans have strong opinions about food — and especially about what not to put on their plates. YouGov recently asked people to tell us in their own words which, if any, foods they despise. Based on their responses, we developed a list of 40 foods with ample haters. Then, in a separate survey, we asked Americans their feelings on each.
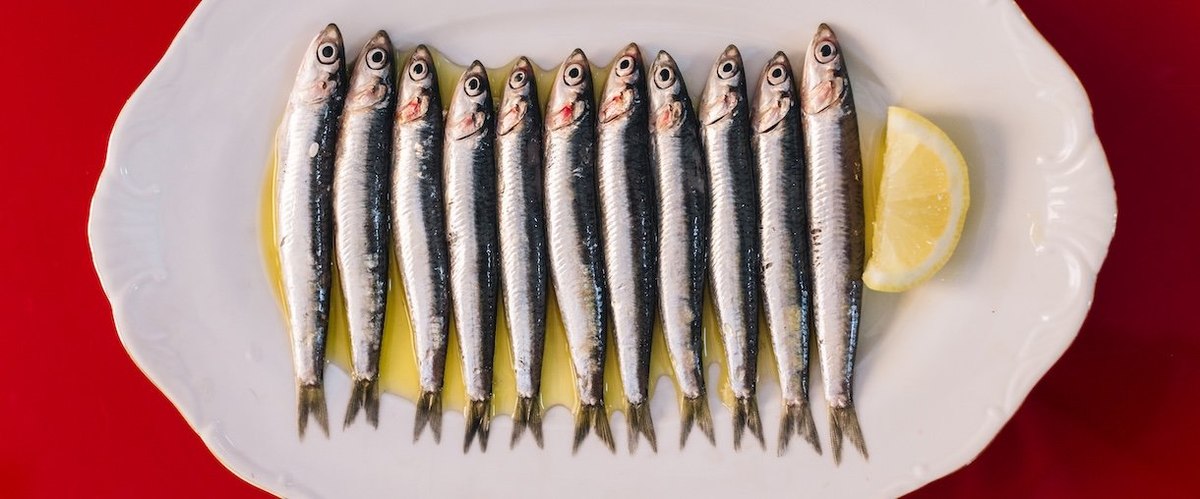
The foods that topped the list of those disliked or hated by the largest share of American adult citizens are anchovies (56% of Americans dislike or hate it), liver (54%), and sardines (52%). Following the top three in widespread unpopularity are tofu (46%), squid (44%), caviar (43%), oysters (42%), blue cheese (39%), sushi (39%), chitterlings (38%), beets (35%), and kale (31%).
A ranking of the most hated foods (excluding those that are only disliked) would look similar, but liver would lead the pack: 40% of Americans say they hate it, compared to 36% who loathe anchovies and 35% who despise sardines.
Many of the most hated foods are protein-heavy seafood. Vegetables — typically bitter ones that aren't starchy — also feature heavily in the list of 40 food types asked about, though they are less universally despised than many of the protein-rich seafood items. A few fruits also made the poll, though some of these — such as tomatoes and olives — are often thought of as vegetables. Blue cheese is the only dairy item included in the poll. Eggs have the fewest detractors of the 40 items in the poll: only 6% of Americans say they hate or dislike them.
One finding: People really like food, even types of food that have lots of detractors. And maybe a food needs enough fans to find its way to the plates of enough people to be widely disliked. Even though we populated our list of 40 types of food by choosing ones many people said they disliked, 31 of the foods are loved or liked by more people than hate or dislike them. The best-liked foods that are disliked by many are eggs (84% love or like) and bananas (82% love or like).
Many of the foods are highly divisive. Kale leads the pack in neutral reactions (31%), and more than one-quarter aren't sure about caviar (26%) or chitterlings (36%).
Younger adults are more likely to dislike condiments, while more older Americans can't stand some types of seafood. Adults under 45 are significantly more likely than older adults to dislike or hate several common condiments, including mustard, mayonnaise, pickles, and olives. Younger adults are also more likely to be unsure about most foods, especially liver, okra, and chitterlings.
Americans 45 and older are more likely than younger adults to have an aversion to several protein-rich foods, including tofu and sushi. Underlying food dislike often exceeds generational differences, though: While younger adults are less averse to tofu and sushi than older ones, those two foods still are among the most disliked by younger adults.
Men are more likely than women to dislike or hate several vegetables, including brussels sprouts, cauliflower, spinach, and broccoli. Women, on the other hand, are more averse than men to several forms of seafood, including anchovies, sardines, squid, oysters, caviar, and sushi. They are also more likely than men to hate or dislike several other protein-rich foods, including liver, chitterlings, and pork. On average, the 40 foods on the list are hated or disliked by 4 percentage points more women than men.
See the results for this YouGov poll
Methodology: The poll was conducted online among 2,239 U.S. adult citizens on two separate surveys from July 24 - 27, 2025 and July 25 - 27, 2025. A random sample (stratified by gender, age, race, education, geographic region, and voter registration) was selected from the 2019 American Community Survey. The sample was weighted according to gender, age, race, education, 2024 presidential vote, 2020 election turnout and presidential vote, baseline party identification, and current voter registration status. 2024 presidential vote, at time of weighting, was estimated to be 48% Harris and 50% Trump. Demographic weighting targets come from the 2019 American Community Survey. Baseline party identification is the respondent’s most recent answer given around November 8, 2024, and is weighted to the estimated distribution at that time (31% Democratic, 32% Republican). The margin of error for the overall sample is approximately 3%.
Image: Getty
What do you really think about President Trump, American politics in general, and everything else? Share your reality, join the YouGov panel, and get paid to share your thoughts. Sign up here.