
It’s hard to believe it’s already Thanksgiving! Many of us will be celebrating differently this year, but the feast goes on. In a YouGov survey two weeks ago, 81% of Americans said they will be celebrating Thanksgiving this year, but the majority said they’re celebrating only with immediate family.
There’s no talking about Thanksgiving without talking about food! Even without wider family gatherings, Google searches for Thanksgiving recipes have only declined less than a third from prior years. It seems an appropriate time to look at how our eating habits have changed this year due to COVID-19.
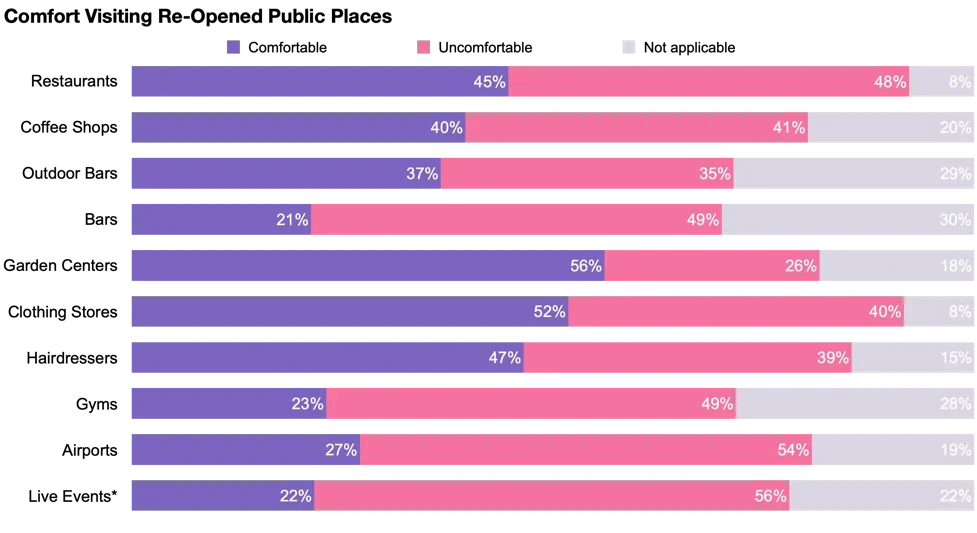
Americans are conflicted about dining out
As a whole, Americans remain ambivalent about going into public spaces. Where do food and beverage establishments sit? About half (45%) of consumers are comfortable going to a restaurant while the other half are not (48%). This is similar to the comfort/discomfort with going to clothing stores and hairdressers. People tend to be more leery of bars, with only one in five saying they’re comfortable there (21%; although this almost doubles for outdoor bars (37%)). That’s similar to the overall level of discomfort we also see for gyms, airports, and live events like sports, music events, and festivals.
If on-premise consumption is key to your brand’s business, communicating comfort and safety will be key to getting consumers back as things reopen.
We’re eating more meals at home
COVID-19 has radically changed where many of us eat. Gone are the days of constant on-the-go meals and frequent dining out... at least for now. Restrictions on restaurant dining, combined with overall skepticism about safety in public places, have created a massive shift from on-premise to at-home dining.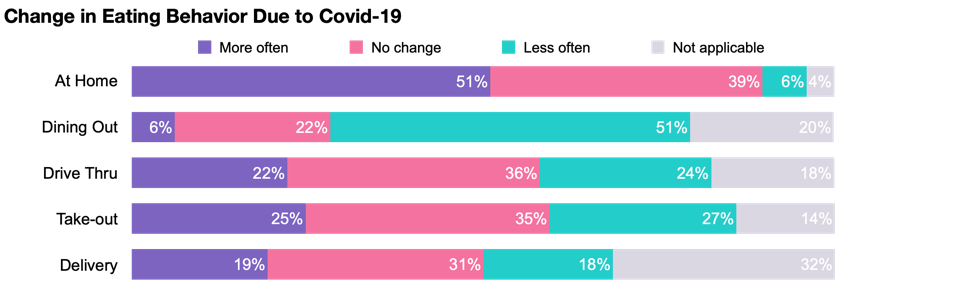
When it comes to other ways to get our meals — drive thru, take-out, delivery — it’s a bit of a tale of two households. Nearly the same proportion of Americans say they are using drive thru less often (22%; logical with fewer commuters) as they say they are using it more often (24%; presumably replacing what were formerly meals eaten at a restaurant). Similar splits in eating behavior can be found for take-out and food deliveries.
Digging in further, we see a large upswing in eating at home and decline in dining out across all age groups, but Gen Z has increased their net usage of drive thru, take-out, and delivery. For other generations, the increases and decreases more or less balance each other out.
In an interesting twist, Foodies are less likely to be heading back into restaurants (71% dine out less often now vs 51% among total), but they are more likely to be eatin[JS7] g take-out (43% get take-out more often than before vs 25% total).
Stocking up the pantry
I talked last week about changes in shopping behavior, and one place we’re spending a lot more is on groceries — both in-store and online. What we’re buying at the grocery store is changing, too. All this cooking at home, when combined with a desire to limit shopping trips (and perhaps a bit of anxiety about product shortages), has increased purchases of frozen and canned foods. Three in ten consumers are purchasing frozen and canned foods more often than before.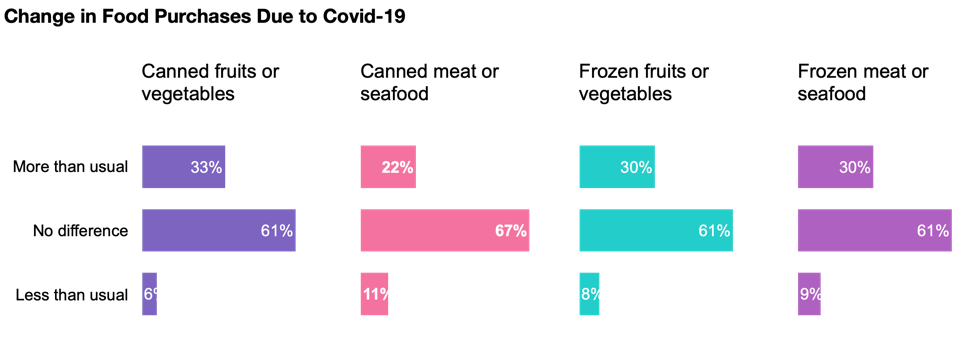
Frozen and canned food purchases increased more among younger consumers (Gen Z and Millennials), who had a lower baseline frequency of cooking at home and using frozen and canned foods. We also see a bigger increase specifically for canned fruits & vegetables among parents of kids under 18, who may be getting creative in providing healthy foods while being time-strapped between overseeing remote-learning and continuing to work their own jobs.
It’s a challenging time for many categories, but staying up-to-date and understanding which groups may be driving certain changes in behaviors can make a big difference in getting in front of audiences that spend an increasing amount of time at home.
Methodology: The data on how comfortable people feel visiting publics places that have reopened is based on the interviews of 88,745 US adults aged 18 and over. All interviews were conducted online between April and November 2020 and all results have been weighted to be nationally representative.
Image: Getty