

Queen Elizabeth II remains the living member of the British Royal Family viewed favorably by the most Americans — though more people have a favorable opinion of Princess Diana, who died in a car crash in 1997. The percentage of Americans who have a very favorable view of the Queen — 28% — is about the same as it was last June.
The Queen’s grandchildren, William and Harry, and their spouses remain more popular with Americans than either Prince Charles, the Duke of Wales; or Camilla, the Duchess of Cornwall, his second wife.
Harry and his wife Meghan are especially popular with Black Americans, 54% of whom hold a favorable opinion of each of them, slightly higher than Black Americans' ratings of the Queen.
Prince Charles and Camilla continue to be seen negatively. More prefer that Prince William succeed Queen Elizabeth II than that Prince Charles be the next monarch. The younger option is more popular among older Americans, while adults under 30 with a preference are split.
Prince Andrew is the least popular British Royal polled. By a margin of two to one, Americans think he should have his title removed because of the allegations made against him by Virginia Giuffre. Most also say that the financial details of his settlement with Giuffre should be public information, especially if public money was involved.
In general, women have more positive opinions of the Royals than men do. And older adults hold more favorable views of the British Royals than younger ones do.
Americans don’t have a strong opinion about whether monarchies like the one in the UK are good or bad: 14% say they are good while 19% say they are bad. Most say they are neither good nor bad (43%) or are unsure (24%).
See the toplines and crosstabs from this Economist/YouGov Poll
Methodology:The Economist survey was conducted by YouGov using a nationally representative sample of 1,500 U.S. adult citizens interviewed online between February 19 - 22, 2022. This sample was weighted according to gender, age, race, and education based on the 2018 American Community Survey, conducted by the U.S. Census Bureau, as well as 2016 and 2020 Presidential votes (or non-votes). Respondents were selected from YouGov’s opt-in panel to be representative of all U.S. citizens. The margin of error is approximately 3% for the overall sample.
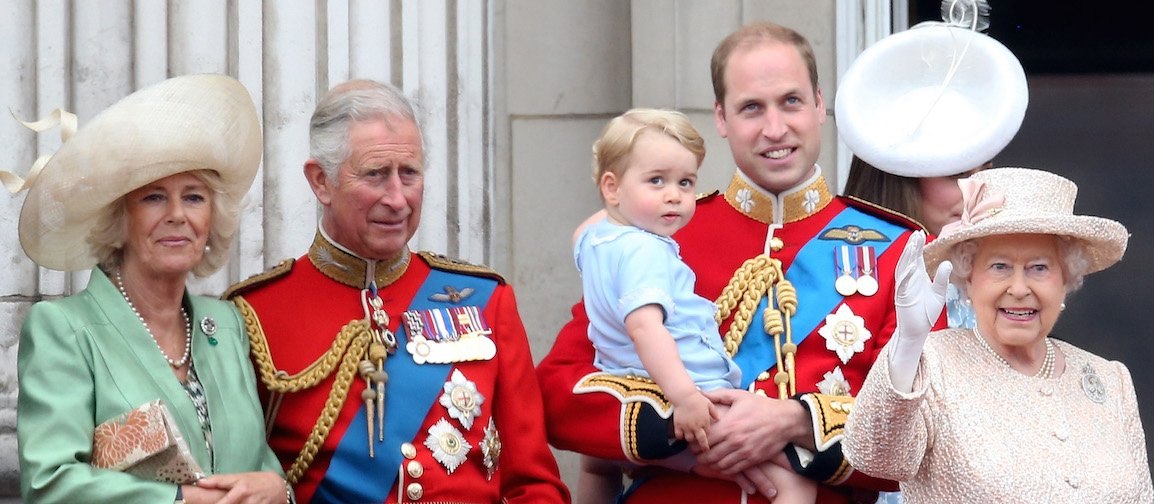
Image: Getty