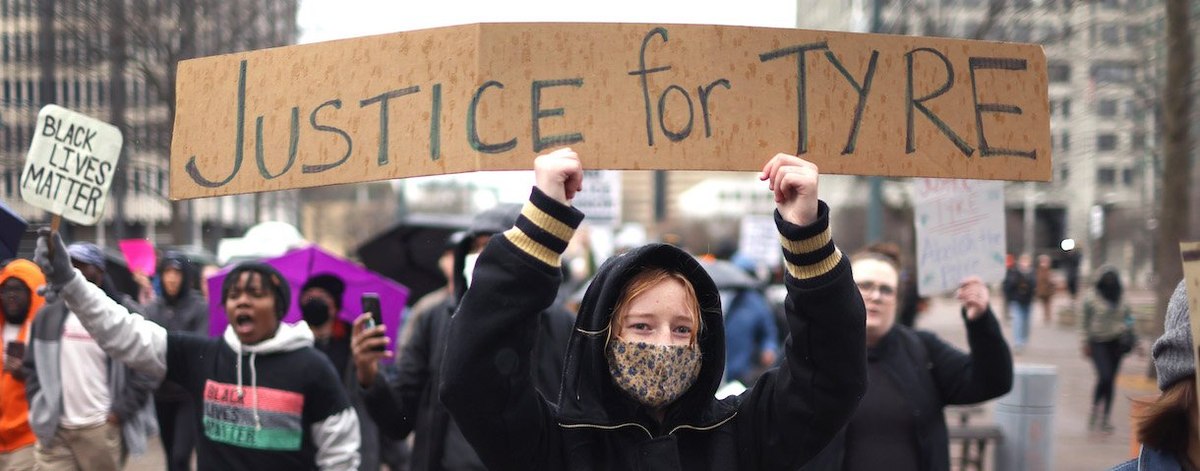
Footage of five police officers beating Tyre Nichols after a traffic stop in Memphis, Tennessee, was released on Friday, two days before the latest Economist/YouGov poll began gathering responses. The poll finds that 43% of Americans have seen parts of the body-camera footage released by the Memphis Police Department. (Nichols died three days after the Jan. 7 beating; the department fired the five officers.) The videos have been viewed at least in part by 47% of Democrats and 52% of Republicans, as well as by 44% of white Americans and 46% of Black Americans. Americans 65 and older are especially likely to have viewed the footage, with 67% saying they have, compared to 31% of adults under 45.
Viewers of footage of the Nichols beating are more likely than Americans overall to believe the police use of force was unjustified, to approve of second-degree murder indictments against the officers, and to believe the officers should be found guilty.
When asked whether the Memphis police were justified in the amount of force they used on Nichols, most Americans (71%) say they were not. Just 8% think they were. Majorities of Democrats and Republicans, as well as of white and Black Americans, think police used an unjustified level of force.
By 72% to 7%, Americans approve of the five Memphis police officers involved in the death of Tyre Nichols being indicted on charges of second-degree murder and kidnapping. Most people — 69% — think the five former police officers should be found guilty of these charges, and slightly fewer — 60% — expect they will be found guilty.
— Carl Bialik and Linley Sanders contributed to this article
See the toplines and crosstabs from the Economist/YouGov poll conducted on January 29 - 31, 2023 among 1,500 U.S. adult citizens.
Methodology: Respondents were selected from YouGov’s opt-in panel using sample matching. A random sample (stratified by gender, age, race, education, geographic region, and voter registration) was selected from the 2019 American Community Survey. The sample was weighted according to gender, age, race, education, 2020 election turnout and presidential vote, baseline party identification, and current voter registration status. Demographic weighting targets come from the 2019 American Community Survey. Baseline party identification is the respondent’s most recent answer given prior to June 1, 2022, and is weighted to the estimated distribution at that time (34% Democratic, 31% Republican). The margin of error for the overall sample is approximately 3%.
Image: Getty (Scott Olson)


