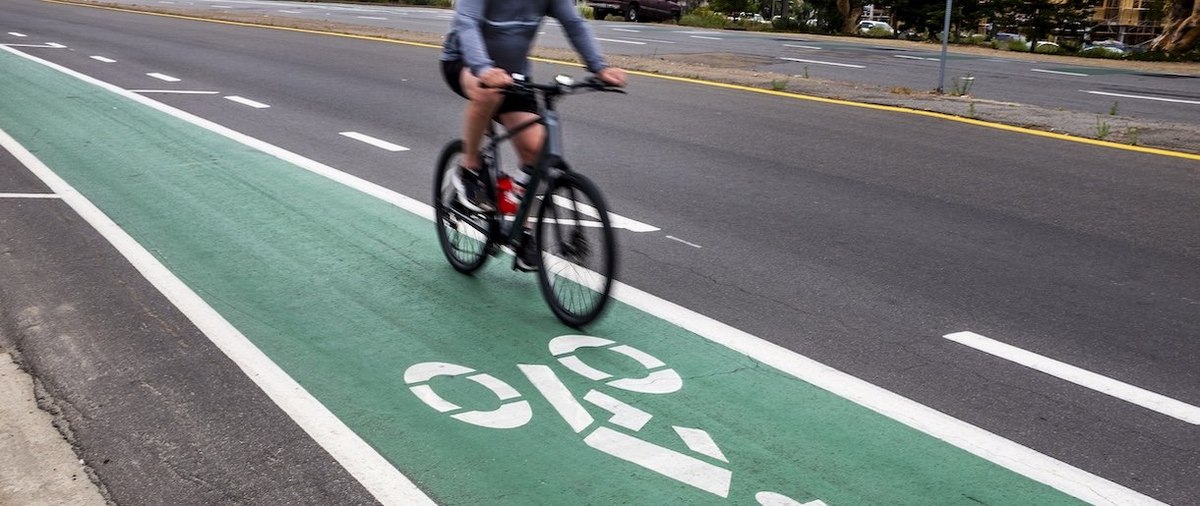
A new YouGov survey finds Americans are generally in support of bike lanes in their community, perhaps because Americans are more likely to say bike lanes increase than decrease overall quality of life as well as safety for pedestrians, cyclists, and drivers.
Two-thirds (67%) of Americans say there are bike lanes in most (23%) or some (43%) places in their local area. 78% of people who live in cities say their area has bike lanes, as do 76% of Americans who live in the suburbs, 57% of people in towns, and 36% of people in rural areas.
One-third (33%) of Americans would prefer for there to be more bike lanes in their local area; 37% would prefer for the number of bike lanes to stay the same and 9% want fewer bike lanes. Democrats are more likely than Republicans to say they want more bike lanes in their area (44% vs. 24%).
Americans are much more likely to support bike lanes in their local area than to oppose them (76% vs. 15%). Americans who live in cities (81%) and suburbs (78%) are more likely than people who live in towns (71%) and rural areas (66%) to support bike lanes in their area. Democrats (90%) are more likely than Republicans (66%) to support bike lanes.
Americans are far more likely to say bike lanes increase overall quality of life than to say they decrease it (46% vs. 5%). They are also more likely to say that bike lanes increase than decrease safety for bicyclists (62% vs. 9%), safety for pedestrians (50% vs. 11%), safety for drivers (44% vs. 14%), and neighborhood property values (27% vs. 5%). Americans are more divided on bike lanes' effects on travel times for bicycles and cars, traffic congestion, and conflicts between bicyclists and drivers or pedestrians.
Americans who live in cities (38%) are more likely than those who live in suburbs (24%), towns (20%), and rural areas (20%) to say bike lanes increase neighborhood property values. City dwellers are also more likely to say bike lanes improve overall quality of life: 53% say this, while slightly fewer Americans in suburbs (46%), towns (45%), and rural areas (39%) say the same.
Among the 18% of Americans who use a bike as a method of transportation at least some days, 70% say bike lanes increase safety for cyclists and 59% say they increase overall quality of life. Among the 58% of Americans who never use a bike for transportation, most (59%) say bike lanes increase safety for cyclists. 46% say bike lanes increase safety for pedestrians, and 43% say they increase overall quality of life.
Democrats are more likely than Republicans to say bike lanes increase quality of life (58% vs. 38%), safety for bicyclists (72% vs. 59%), safety for pedestrians (59% vs. 46%), and neighborhood property values (32% vs. 21%).
Among Americans who have bike lanes in their area, most (60%) say the lanes are in excellent (13%) or good (47%) condition. 27% say the lanes are in fair condition and 8% say the lanes are poor.
Among the 33% of Americans who want more bike lanes in their area, 35% say they would be willing to replace a parking lane for cars in order to add bike lanes. 26% would be willing to replace a traffic lane for cars, 17% would be willing to replace a sidewalk, and 16% wouldn’t take any of those options to add more bike lanes. (Respondents could indicate willingness to replace more than one kind of public space with bike lanes.)
39% of people who bike for transportation at least sometimes and want more bike lanes would replace a parking lane for cars in order to add more bike lanes. Among people who never bike for transport but want more bike lanes, 27% would be willing to replace a parking lane for cars.
Related:
- How safe do U.S. adults believe public transportation in cities is from crime?
- How do Americans feel about walking, driving, and other ways they get around?
- You can ride your skateboard on the sidewalk, but keep your bike on the street, say Americans
See the results for this YouGov survey
— Carl Bialik, Taylor Orth, and Marcel Moran contributed to this article
Methodology: This article includes results from an online survey conducted March 17 - 19, 2025 among 1,140 U.S. adult citizens. Respondents were selected from YouGov’s opt-in panel to be representative of adult U.S. citizens. The sample was weighted according to gender, age, race, education, 2024 presidential vote, 2020 election turnout and presidential vote, baseline party identification, and current voter registration status. 2024 presidential vote, at time of weighting, was estimated to be 48% Harris and 50% Trump. Demographic weighting targets come from the 2019 American Community Survey. Baseline party identification is the respondent’s most recent answer given around November 8, 2024, and is weighted to the estimated distribution at that time (31% Democratic, 32% Republican). The margin of error for the overall sample is approximately 4%.
Image: Getty
What do you really think about President Trump, American politics in general, and everything else? Share your reality, join the YouGov panel, and get paid to share your thoughts. Sign up here.


