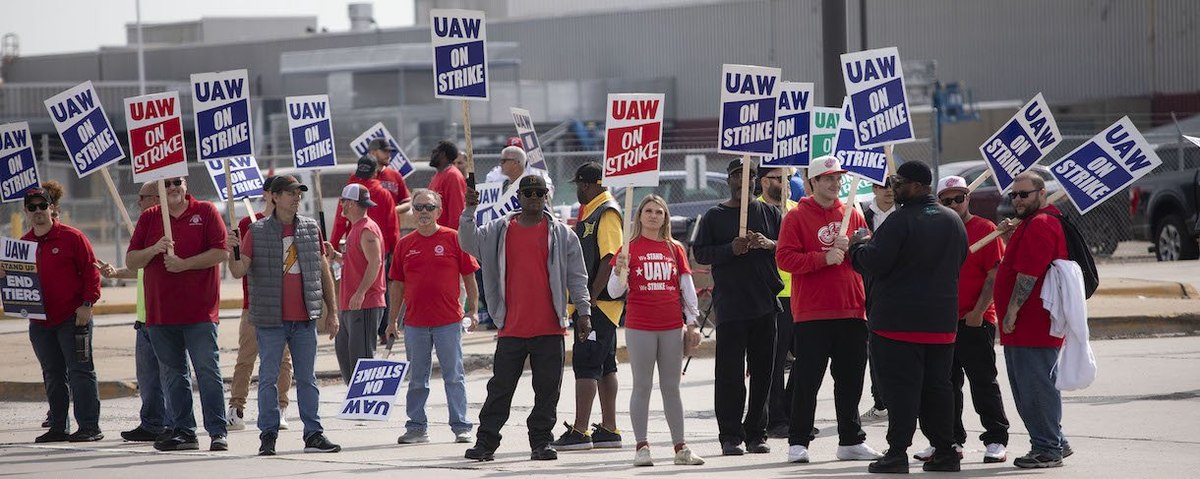


New polling by the Economist/YouGov finds that more Americans side with the United Auto Workers (50%) than with General Motors, Ford, and Stellantis (20%) in the recent strike over auto workers' pay. Opinions on the strike, as with other labor issues, are partisan: Democrats overwhelmingly support the UAW (71% to 10%), while Republicans are evenly divided (35% to 34%).
When asked more broadly about disputes between union workers and company management, Americans also are more likely to side with workers: 50% say they normally favor workers in such disputes, while just 15% say they typically side with company management. About half of Americans (49%) have a strongly or somewhat favorable opinion of unions overall, while about one-third (32%) hold strongly or somewhat unfavorable opinions.
How do opinions on the recent UAW strike compare to opinions on the union's last major strike, against General Motors in 2019? More Americans have heard a lot about the recent strike than did in October 2019 (28% vs. 19%), and more side with UAW now than did then (50% vs. 44%). A much larger share now expect the recent strike to have a major impact on the economy than did in 2019 (39% vs. 19%).
See the toplines and crosstabs from the Economist/YouGov poll conducted on September 17 - 19, 2023 among 1,500 U.S. adult citizens.
Methodology: Respondents were selected from YouGov’s opt-in panel using sample matching. A random sample (stratified by gender, age, race, education, geographic region, and voter registration) was selected from the 2019 American Community Survey. The sample was weighted according to gender, age, race, education, 2020 election turnout and presidential vote, baseline party identification, and current voter registration status. Demographic weighting targets come from the 2019 American Community Survey. Baseline party identification is the respondent’s most recent answer given prior to November 1, 2022, and is weighted to the estimated distribution at that time (33% Democratic, 31% Republican). The margin of error for the overall sample is approximately 3%.
Image: Getty (Bill Pugliano)