
Introduction
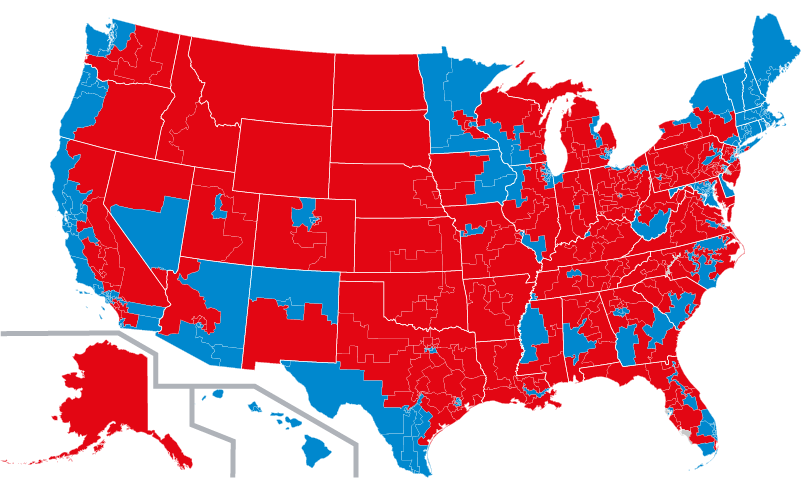
The Battleground Tracker is a four-wave panel study conducted by YouGov for CBS News and the New York Times Upshot during the 2014 midterm elections. The survey provides estimates for voting on every race for U.S. Senate, Governor, and the House of Representatives. Interviews are conducted with samples of online survey panelists that have been selected and weighted to be representative of registered voters. This document describes in detail the statistical methodology used in the Battleground Tracker panel.
There are three basic steps in data collection:
- Creation of a frame representing the U.S. population that includes detailed demographic data (from the U.S. Census Bureau) and 2012 voting behavior (from the 2012 National Election Pool Exit Poll).
- A target sample of the desired size is selected from the frame using probability sampling.
- A matched sample is selected from a pool of panelists with similar demographics and voting patterns to those in the target sample.
The pool of panelists come from online opt-in panels. Matched sampling is a method of purposive selection designed to produce a sample representative of the target population. The general procedures described here have been used at YouGov in the U.S. since 2006 for the Cooperative Congressional Election Surveys (see http://projects.iq.harvard.edu/cces/home) with some modifications described below.
Sample Design
The target population for the CBS News/New York Times Battleground Tracker is registered voters for 2014 midterm elections in the U.S., excluding D.C. Oversamples of (a) 66 competitive congressional districts, and (b) 15 smaller states where there are Senate or Governor’s races which, if sampled proportionately, would have few interviews. (The population of Wyoming, for example, is smaller than the average congressional district.)
The sample is intended to be representative of the target population (all registered voters in the U.S.). In conventional probability sampling, the sample is usually drawn with minimal information about respondents prior to selection. Random sampling ensures that those selected will be representative of the population, in theory, though in practice, it has been shown that because of the lower response rates today they can be effectively opt-in as well. Instead, we use purposive sampling (selecting respondents based upon their characteristics) to obtain a sample that is constructed to be representative of the population in terms of a specified set of characteristics.
The first step in the sample selection process is to construct a frame of detailed individual level records of members of the target population. The frame is based on official U.S. Census Bureau statistics and past voting patterns as found in the 2012 Presidential Election Exit Poll conducted by the National Election Pool (NEP), a consortium of news organizations.
The following sources were used to create the frame:
2010 US Census Congressional District Summary File (113th Congress) (Technical Documentation, April 2013) provides a cross-classification of age, gender and race (non-Hispanic whites, blacks, Hispanics, Asian, and all others) based on the 2010 U.S. Census.
2012 American Community Survey (ACS) Public Use Microsample provides data on education, citizenship, marital status, employment status, and home ownership. These variables were imputed onto the 2010 Census data using Geocorr12 (a geographical database maintained by the Missouri Census Data Center) to estimate geographic overlap.
Current Population Survey (CPS) November 2012 Registration and Voting Supplement provides data on voter registration and turnout in the November 2012 U.S. Presidential election. These data were imputed onto the partial frame created in steps 1 and 2 using multinomial logit models.
NEP Exit Poll was used to impute 2012 candidate choice onto the records for voters in the previous step based upon demographic and geographic characteristics common to both sources. Probabilities were estimated using multinomial logit models.
A post-stratification weight for the frame was computed by raking the imputed data to match turnout and vote counts at the Congressional District (CD) level as well as ACS demographics. This preserves the joint distribution of age by gender and race by education found in the ACS sample. To eliminate the weights, the data were then resampled with probabilities inversely proportional to the raking weights.
The resulting frame includes the following data on each individual level record: Congressional district, Census demographics (age, gender, race), ACS demographics (education, citizenship, marital status, employment status, and home ownership), CPS voter registration and turnout in the 2012 election, and Presidential and Senate vote from NEP Exit Poll states. This is the basis for sample selection and weighting, described next.
Sample Selection and Weighting
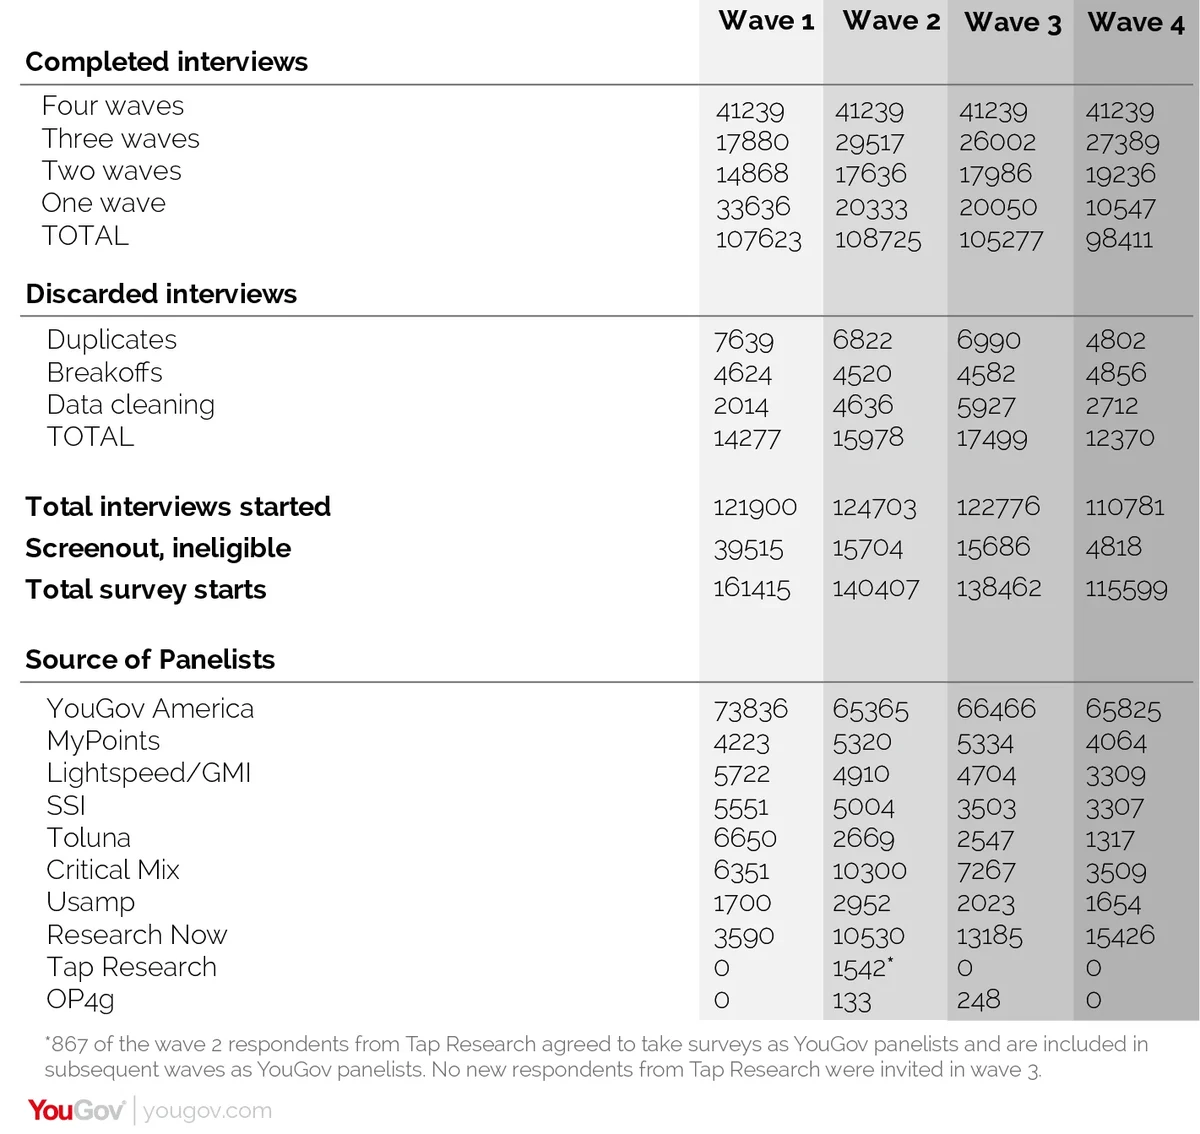
The sample was selected from a pool of online panelists to approximately match the characteristics of those on the frame. The primary source of panelists was the YouGov America panel, supplemented by other online panels. The YouGov panel is recruited primarily through internet advertising (Google Adwords, Facebook, banner ads) and referrals. The other panels use mostly co-registration and advertising for recruitment. Sources and counts of all panelists are included in the disposition reports for each wave of the Battleground Tracker.
Sample inclusion probabilities (“propensity scores”) were estimated using a case-control logistic regression model (where the frame is the control group and the sample is the case or treatment group) and divided into propensity score deciles. Finally, the sample was raked to propensity score deciles, demographics, and 2012 Presidential vote, with the weights trimmed to a maximum value of six within each of 115 strata (defined by congressional district for oversampled districts or rest of state for the remainder). A national population weight was obtained by multiplying the raked weights by the ratio of weighted sample size in each stratum to the estimated number of registered voters in that stratum.
Interviewing Procedures
The survey was conducted using YouGov’s web-based survey system. Third party panelists were selected based upon criteria determined by YouGov and invited via an email with a link which took them to the YouGov survey system.
To discourage duplicate responses, visitors to the YouGov survey system are “cookied” so that repeat visitors can be detected and discarded from the sample. (Users can delete cookies from their system, but only 3 percent of YouGov panelists who have taken a previous survey in the past 90 days have done so.)
In addition, interviews were discarded if one of the following conditions occurred:
- Breakoffs
- More than 50% of the questions were skipped. (Respondents were allowed to skip any question except for age and voter registration, though most respondents answered all or nearly all of the questions.)
- Interviews that were completed in less than four minutes.
- Respondents who said their birth year was prior to 1915 or after 1996.
- Respondents who did not provide an address (so we were unable to determine their congressional district) and other information required for estimation and weighting (except for education, which was imputed).
Counts of the number of the number of discarded interviews are provided in the disposition report for each wave of the Battleground Tracker.
Margins of Error
The “margin of error” is calculated using model-based standard errors, which estimate the variability of estimates from repeated application of the same procedures. Model-based standard errors depend on the assumption that responses are independent and that the selection mechanism is “missing at random.” (See R.J.A. Little and D.B. Rubin, Statistical Analysis with Missing Data, 2nd ed., Wiley, 2002.) This means that the survey responses are conditionally independent of the selection mechanism conditional upon the matching and weighting variables; that is, given any specific combination of matching and weighting variables, we assume that panelists have the same likelihood of voting (or answering other questions in the survey) as non-panelists with the same characteristics. It does not assume that the data come from a probability sample with known probabilities of selection.
Standard errors are computed using formula (29) in J.K. Kim and M.K. Riddles, “Some theory for propensity-score-adjustment estimators in Survey Sampling,” Survey Methodology (December 2012), vol 38, pp. 157-165. The estimated probabilities in equation (24) of Kim and Riddles uses the reciprocal of the final raking weight and the variance estimates are averaged for each of the vote variables.
House Election Model
Because many of the individual congressional district samples are small, hierarchical regression models were estimated for turnout and congressional vote as a function of demographics and past vote, with the coefficients varying by congressional district. In the hierarchical model, the coefficients were modeled as a function of individual respondent characteristics (age, race, gender, education, 2012 Presidential vote, and 2014 Senate vote) and district level characteristics (past vote, incumbency status, and election spending), using a multinomial logit model. The estimated probabilities were then imputed to all units on the frame. The sample units were then raked to the marginals on the frame, so that the weighted sample counts are equal to the average model imputations. This technique uses data from voters with similar characteristics to determine the final weights.
The main differences between this procedure and the previous CCESwere (a) the construction of the new Congressional district frame with precise CD-level demographics and voting behavior, and (b) the use of the hierarchical logistic regression model to obtain better estimates of voting for House candidates even when the sample size in a district is small.
Dispositions