This is a summary of a YouGov/Economist Poll conducted July 30-August 1, 2016. The sample is 1300 general population respondents with a Margin of Error of ±4% (4.1% for registered voters).
GENERAL ELECTION (among registered voters):
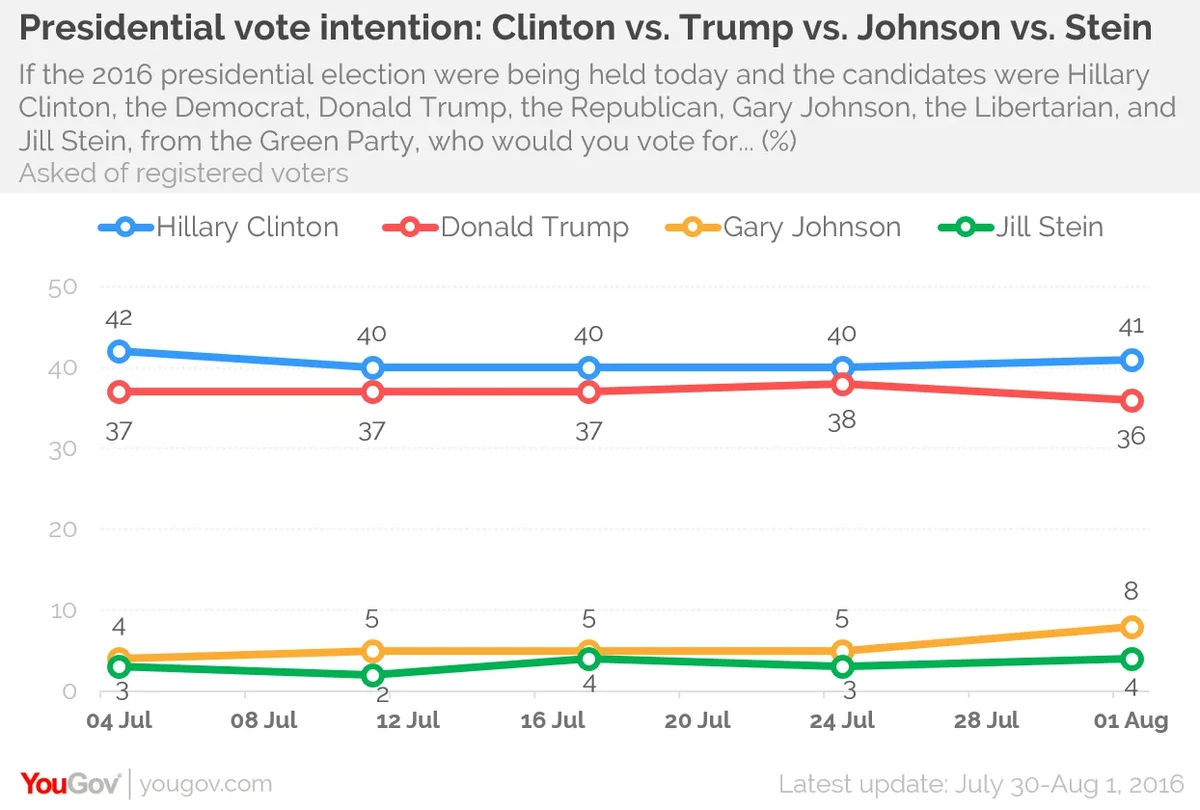
If the 2016 presidential election were being held today and the candidates were Hillary Clinton, the Democrat, Donald Trump, the Republican, Gary Johnson, the Libertarian, and Jill Stein, from the Green Party, who would you vote for?
- Hillary Clinton: 41% (+1)
- Donald Trump: 36% (-2)
- Gary Johnson: 8% (+3)
- Jill Stein: 4% (+1)
- Someone else: 2%
- Not sure yet: 7%
- Probably won't vote: 2%
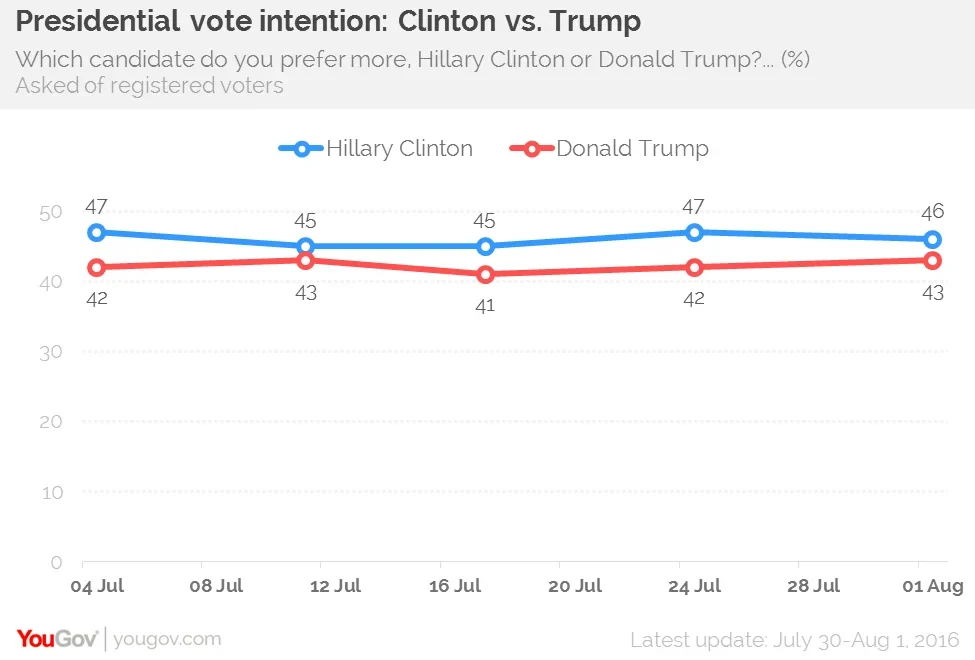
2-way follow-up: Respondents who selected Gary Johnson, Jill Stein, or ’someone else’ were asked the following question ’Which candidate do you prefer more, Hillary Clinton or Donald Trump?’ Below those responses have been added to the support for Clinton and Trump from the initial question.
- Hillary Clinton: 46% (-1)
- Donald Trump: 43% (+1)
- Someone else / Not sure yet / No preference: 9%
- Probably won't vote: 2%
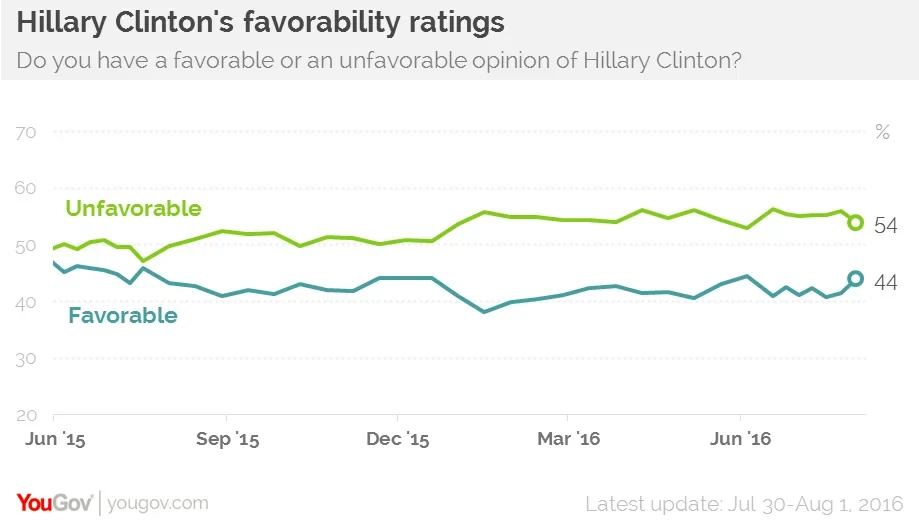
Hillary Clinton favorability (among all adults):
- Favorable: 44% (+2)
- Unfavorable: 54% (-2)
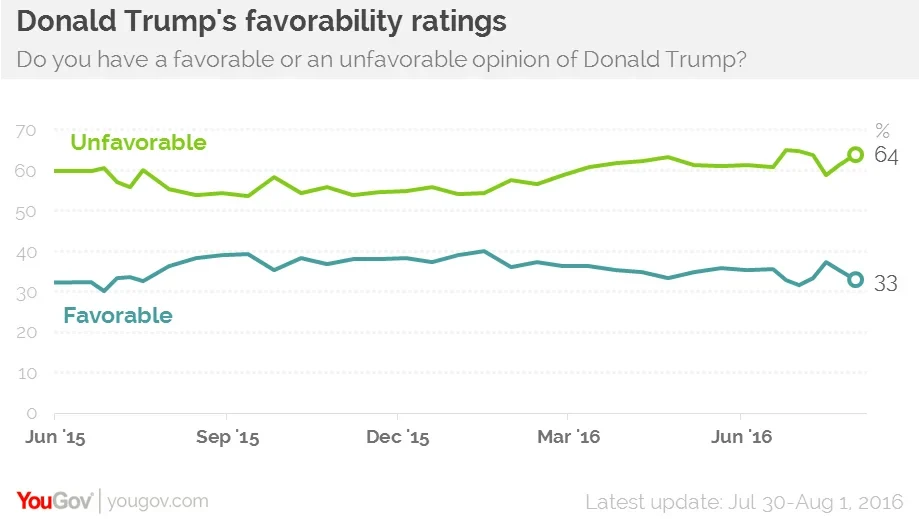
Donald Trump favorability (among all adults):
- Favorable: 33% (-2)
- Unfavorable: 64% (+3)
CONGRESS (among registered voters):
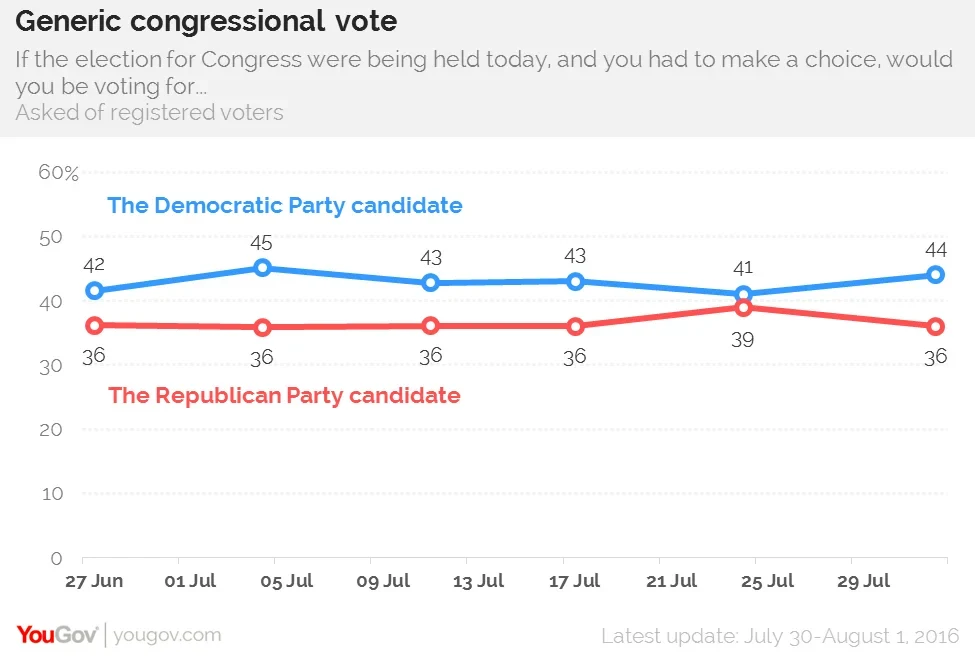
If the election for Congress were being held today, and you had to make a choice, would you be voting for...
- The Democratic Party candidate: 44% (+3)
- The Republican Party candidate: 36% (-3)
- Other: 2%
- Not sure: 14%
- I would not vote: 3%
Approval of Obama as president (among all adults):
- Approve: 50% (+3)
- Disapprove: 44% (-4)
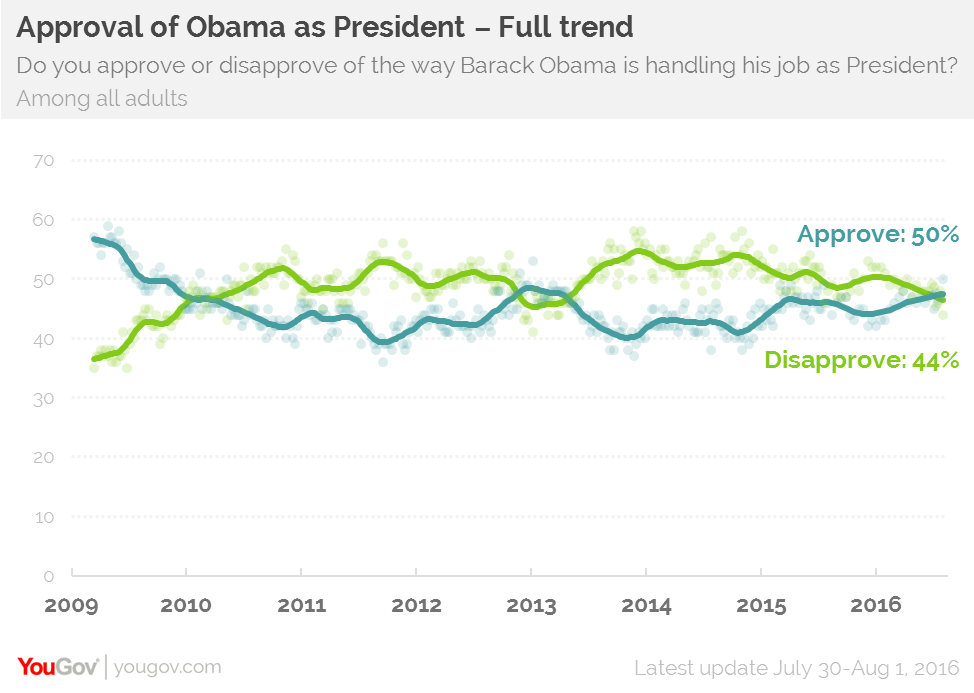
This is the first time Barack Obama's approval rating has reached 50% since January 2013.
Among registered voters, 48% approve of Obama and 49% disapprove.
Approval of Congress:
- Approve: 10% (-1)
- Disapprove: 65% (+7)
Direction of the country:
- Right direction: 29% (+5)
- Disapprove: 61% (-6)
Other highlights:
Presidential election
- Since last week, Clinton has seen an increase in the number who say she's ready to be Commander-in-Chief (43% to 49%), who say they are confident in her ability to deal with terrorism (from 35% to 44%), and who say they are confident in her ability to deal with the economy (38% to 43%).
- 52% expect Clinton to win the election, compared to 49% last week
- Tim Kaine has also received a convention bump: 37% now have a favorable opinion of Kaine, while 32% have an unfavorable opinion. 31% still don't know. While this is less positive than other, better-known Democrats who spoke at the convention – like Barack Obama (53%-45%), Joe Biden (51%-37%) or Bernie Sanders (61%-31%) – Kaine is the only person on either party's ticket with a net-positive rating. Kaine's +5 rating compares to -6 for Mike Pence, -10 for Hillary Clinton and -31 for Donald Trump.
Democratic National Convention
- 74% of Americans at least read or watched news about the DNC, identical to the RNC last week.
- By 59% to 23% these respondents said it was "well managed" rather than "poorly run". This is much higher than the RNC (43%-38%).
- By 33% to 33% audiences say more time was spent attacking Donald Trump than explaining what Hillary Clinton would do as president. Of the RNC, more said attacking Clinton was the focus by 46% to 20%.
- 52% said Clinton's convention speech was "excellent" or "good", while 28% said it was only "fair" or "poor". Trump's ratings were 42% excellent/good and 37% fair/poor.
- Other speeches were rated even more highly than Clinton's however. Michelle Obama's speech was the best-received: 67% excellent/good to 18% fair/poor; Barack Obama's was close behind (60%-23%). Then Biden (48%-26%) and Tim Kaine (39%-32%).
- By 60% to 17% audiences said Clinton's speech was optimistic rather than pessimistic. For Trump, it was 42% optimistic, 35% pessimistic.
Russia, Wikileaks and the DNC
- 45% of Americans are confident in Hillary Clinton's ability to deal wisely with Russia, versus 30% for Donald Trump.
- 37% have a favorable opinion of Wikileaks, 32% unfavorable. Opinions split along 2016 support: Clinton voters lean towards unfavorable views by 26%-52%, while Trump voters lean towards favorable views by 47%-26%.
- By 56% to 10% Americans approve of the resignation of Debbie Wasserman Schultz as head of the Democratic National Committee. Even Democrats support the resignation by 50% to 11%.
- While 60% say the DNC was biased in favor of Hillary Clinton, only 39% think Clinton's victory in the primary depended on that interference. However, 56% of Bernie Sanders primary supporters say Clinton only won the primary because the DNC interfered on her behalf.
- 29% of Americans believe the Russians were responsible for hacking the DNC, while 22% say they were not and 49% aren't sure. Again there is a big divide according to 2016 support: 53% of Clinton voters blame Russia, versus only 18% of Trump voters. 52% of Trump voters say they are unsure who was responsible.
- Americans are also divided on whether Trump was serious or sarcastic when he appeared to call on Russia to "find" Clinton's 30,000 State Department emails. 43% say "serious" and 46% say "sarcastic".
- The public overwhelmingly view the remarks as inappropriate by 58% to 27%. More Republicans, however, say Trump's remarks were appropriate than inappropriate (51% to 32%)
Additional questions and detailed demographic breakdowns: PDF
Topline summary: PDF
National Tracking Report: PDF
Presidential Election Tracking Report: PDF