This is a summary of a YouGov/Economist Poll conducted August 11-16, 2016. The sample is 1300 general population respondents with a Margin of Error of ±4.1% (4.1% for registered voters).
GENERAL ELECTION (among registered voters):
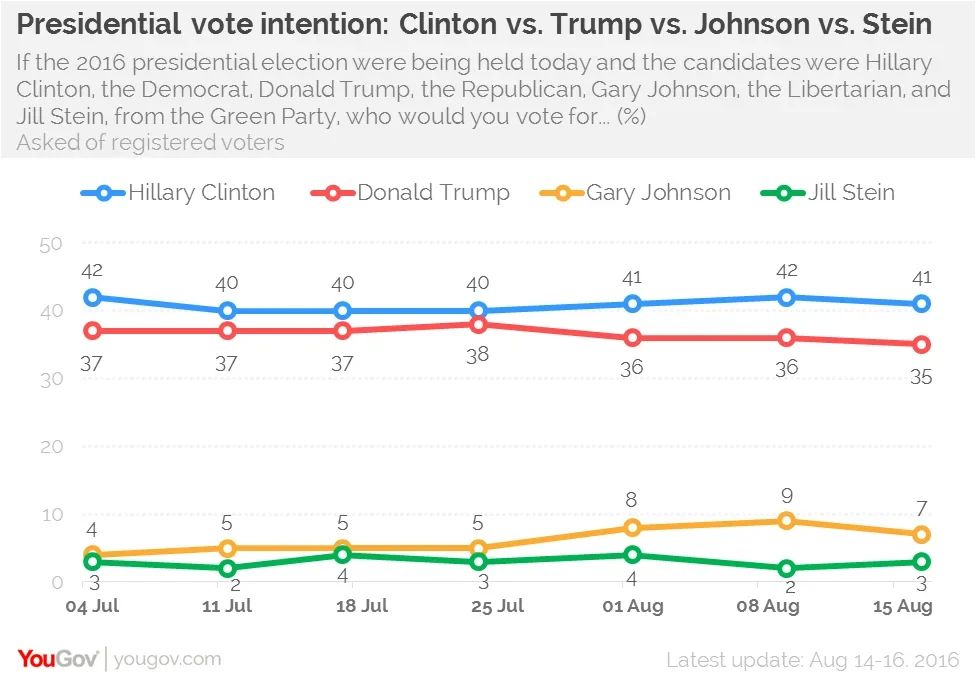
If the 2016 presidential election were being held today and the candidates were Hillary Clinton, the Democrat, Donald Trump, the Republican, Gary Johnson, the Libertarian, and Jill Stein, from the Green Party, who would you vote for?
- Hillary Clinton: 41% (-1)
- Donald Trump: 35% (-1)
- Gary Johnson: 7% (-2)
- Jill Stein: 3% (+1)
- Someone else: 2%
- Not sure yet: 8%
- Probably won't vote: 3%
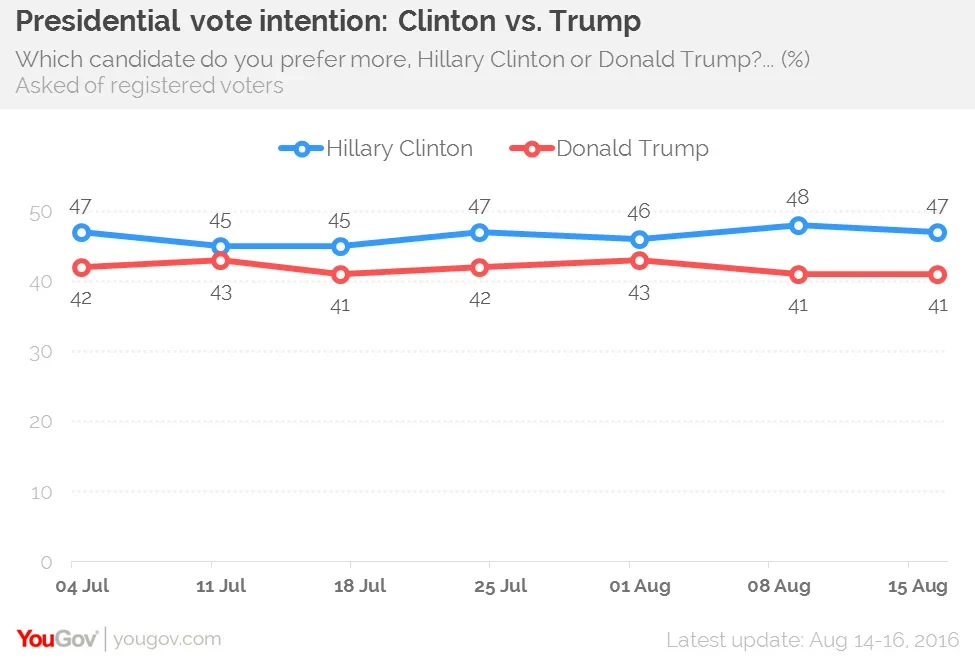
2-way follow-up: Respondents who selected Gary Johnson, Jill Stein, or ’someone else’ were asked the following question ’Which candidate do you prefer more, Hillary Clinton or Donald Trump?’ Below those responses have been added to the support for Clinton and Trump from the initial question.
- Hillary Clinton: 47% (-1)
- Donald Trump: 41% (0)
- Someone else / Not sure yet / No preference: 9%
- Probably won't vote: 3%
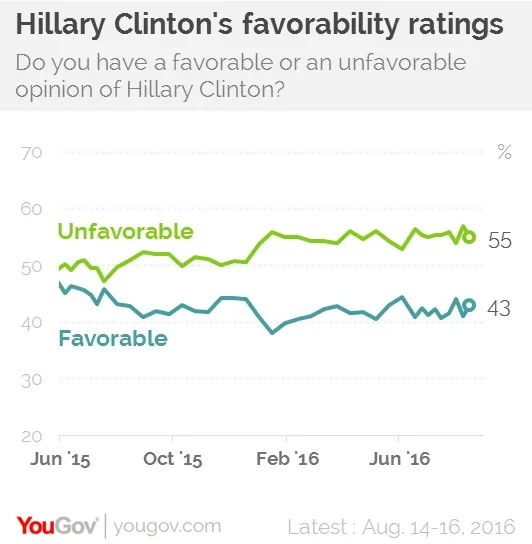
Hillary Clinton favorability (among all adults):
- Favorable: 43% (+2)
- Unfavorable: 55% (-2)
Donald Trump favorability (among all adults):
- Favorable: 32% (-2)
- Unfavorable: 66% (+3)
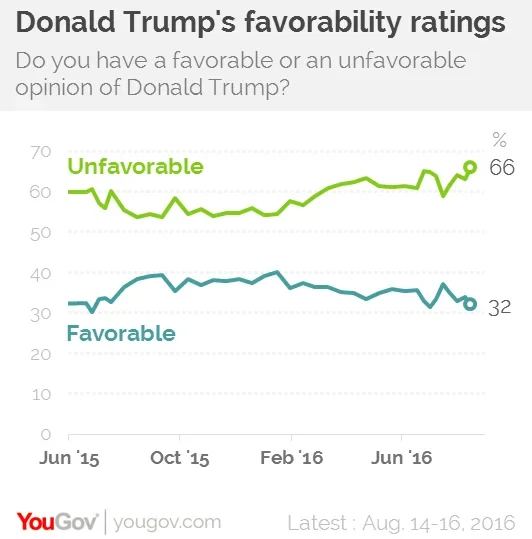
Donald Trump's unfavorable rating (66%) is nominally the worst of his presidential campaign so far, as is his net-favorable rating, -34.
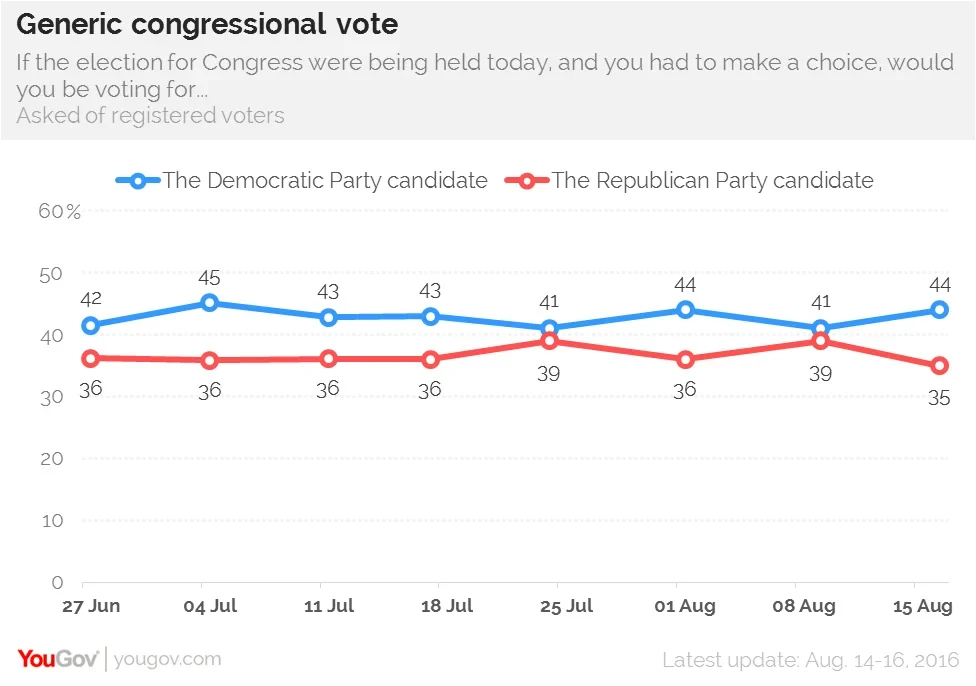
CONGRESS (among registered voters):
If the election for Congress were being held today, and you had to make a choice, would you be voting for...
- The Democratic Party candidate: 44% (+3)
- The Republican Party candidate: 35% (-4)
- Other: 3%
- Not sure: 16%
- I would not vote: 2%
Approval of Obama as president (among all adults):
- Approve: 53% (+3)
- Disapprove: 46% (-1)
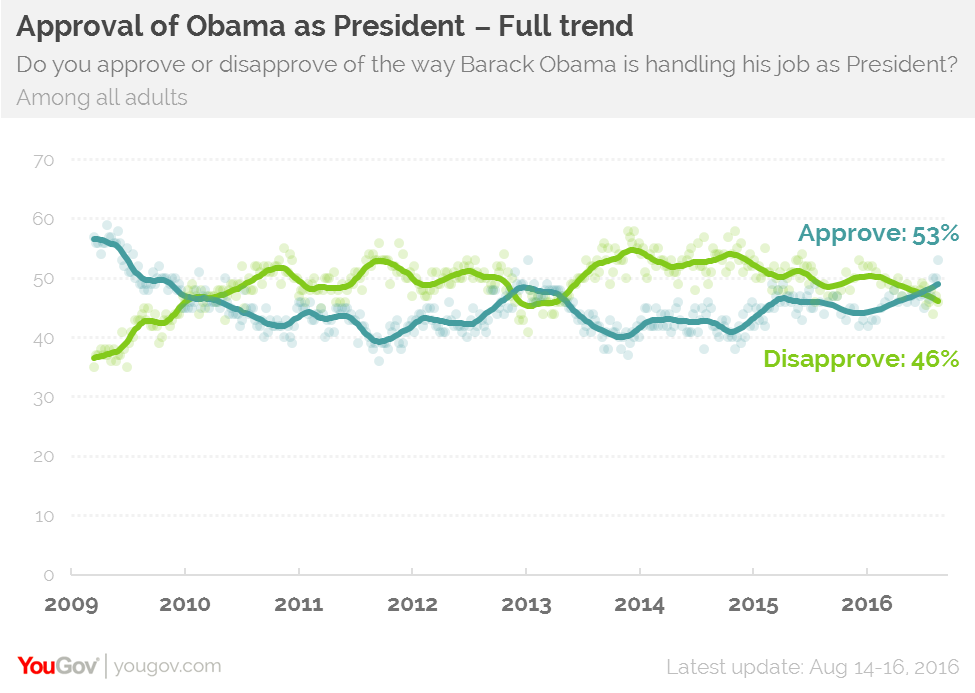
Among registered voters, 49% approve of Obama and 50% disapprove.
Approval of Congress:
- Approve: 9% (-4)
- Disapprove: 65% (+3)
Direction of the country:
- Right direction: 26% (-3)
- Wrong Track: 65% (+2)
Other highlights:
Presidential election
- By 52%-40% Americans are more uneasy than confident in Hillary Clinton's ability to handle terrorism, little-changed from last week (49-41). Unease is higher for Trump, at 58-35.
- By 54% to 26% Americans tend to think Clinton will win the election.
- 64% now believe Trump's campaign is poorly managed, up from 59% last week.
Economic plans
- 82% of have heard something about Hillary Clinton's plans for the economy, versus 74% for Donald Trump
- Overall, slightly more have confidence in Clinton than Trump to handle tax policy (38% to 32%) and the economy generally (40% to 35%)
- Asked who would be better for each group, Americans tend to say Clinton would be better for the poor (49-23), the middle class (45-32), and small businesses (41-34); Trump is seen as better for the wealthy (51-24), Wall Street (38-33), and big businesses (51-25).
Candidate health
- By 39% to 35% Americans tend to think Donald Trump is older than Hillary Clinton (Trump is over a year older)
- 58% say Hillary Clinton's physical condition is good enough to effectively serve as president, while 28% take the opposite view. For Trump, the split is 66% to 17%.
- There are some partisan differences on the issue of health: while the majority (55%) of Democrats say Trump is healthy enough, Republicans tend to think Clinton is NOT by 48% to 39%.
Additional questions and detailed demographic breakdowns: PDF
Topline summary: PDF
National Tracking Report: PDF
Presidential Election Tracking Report: PDF