This is a summary of a YouGov/Economist Poll conducted August 27-29, 2016. The sample is 1300 general population respondents with a Margin of Error of ±4.1% (4% for registered voters).
GENERAL ELECTION (among registered voters):
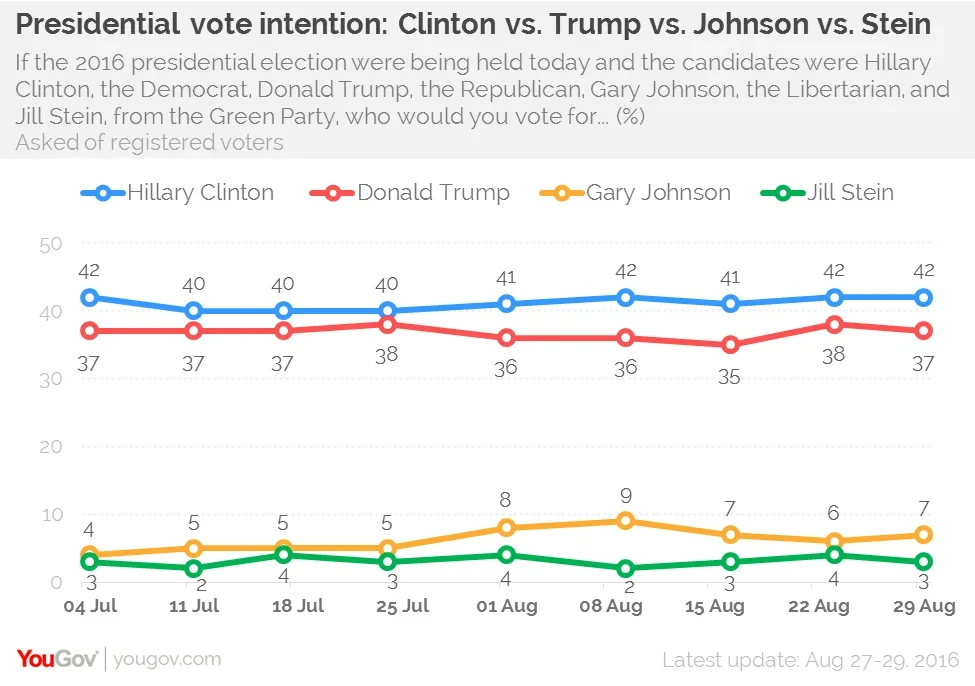
If the 2016 presidential election were being held today and the candidates were Hillary Clinton, the Democrat, Donald Trump, the Republican, Gary Johnson, the Libertarian, and Jill Stein, from the Green Party, who would you vote for?
- Hillary Clinton: 42% (0)
- Donald Trump: 37% (-1)
- Gary Johnson: 7% (+1)
- Jill Stein: 3% (-1)
- Someone else: 2%
- Not sure yet: 7%
- Probably won't vote: 2%
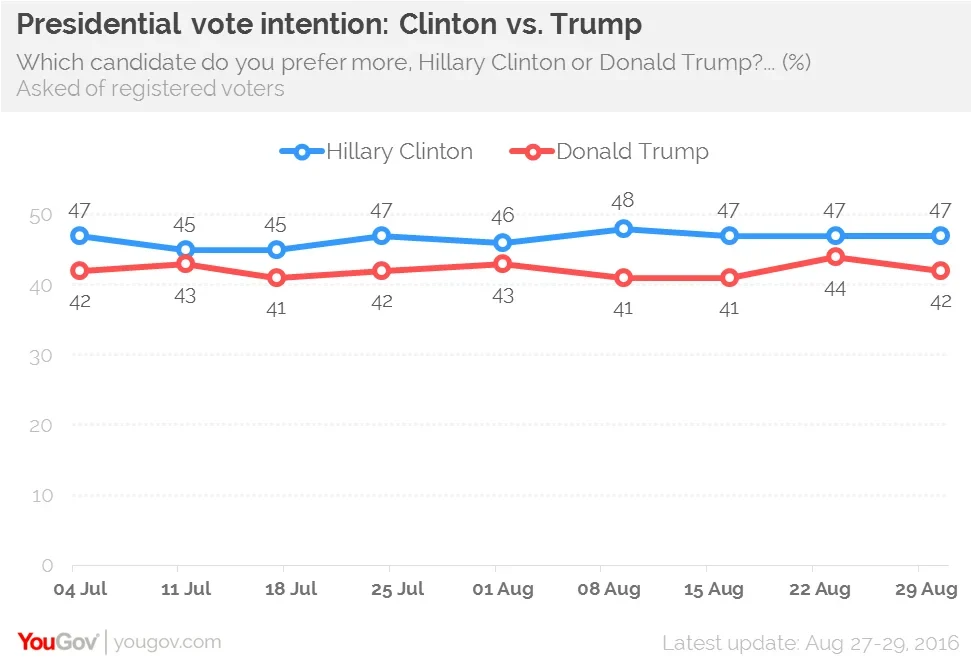
2-way follow-up: Respondents who selected Gary Johnson, Jill Stein, or ’someone else’ were asked the following question ’Which candidate do you prefer more, Hillary Clinton or Donald Trump?’ Below those responses have been added to the support for Clinton and Trump from the initial question.
- Hillary Clinton: 47% (0)
- Donald Trump: 42% (-2)
- Someone else / Not sure yet / No preference: 8%
- Probably won't vote: 2%
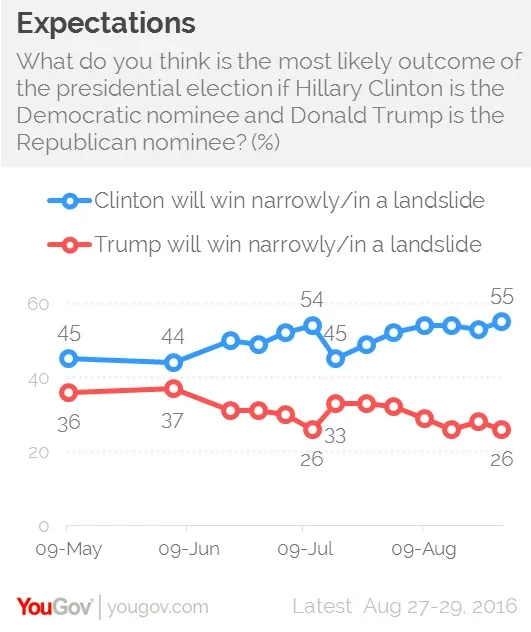
What do you think is the most likely outcome of the presidential election with Hillary Clinton as the Democratic nominee and Donald Trump as the Republican nominee?
- Clinton will win in a landslide: 23% (-2)
- Clinton will win narrowly: 32% (+3)
- Trump will win narrowly: 19% (0)
- Trump will win in a landslide: 7% (-2)
- Not sure: 18% (-1)
Hillary Clinton favorability (among all adults):
- Favorable: 41% (-3)
- Unfavorable: 58% (+5)
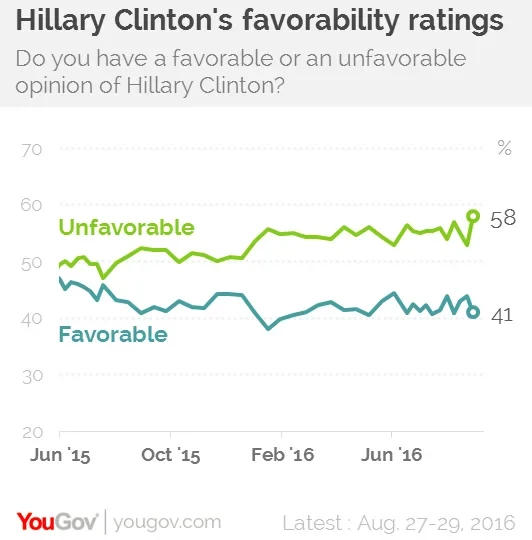
Fifty-eight percent is a new high for Hillary Clinton's unfavorable rating, above the previous high of 57%.
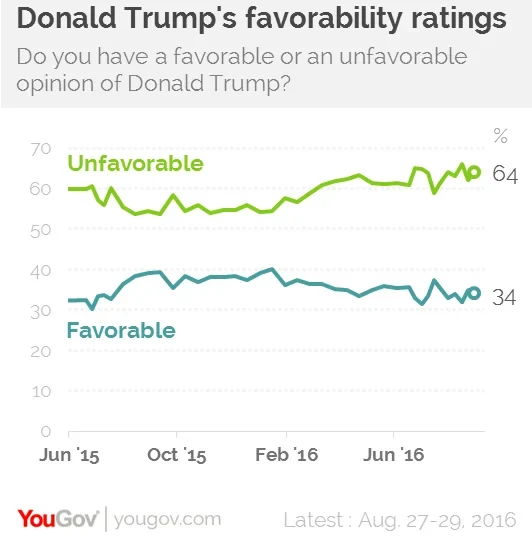
Donald Trump favorability (among all adults):
- Favorable: 34% (-1)
- Unfavorable: 64% (+2)
CONGRESS (among registered voters):
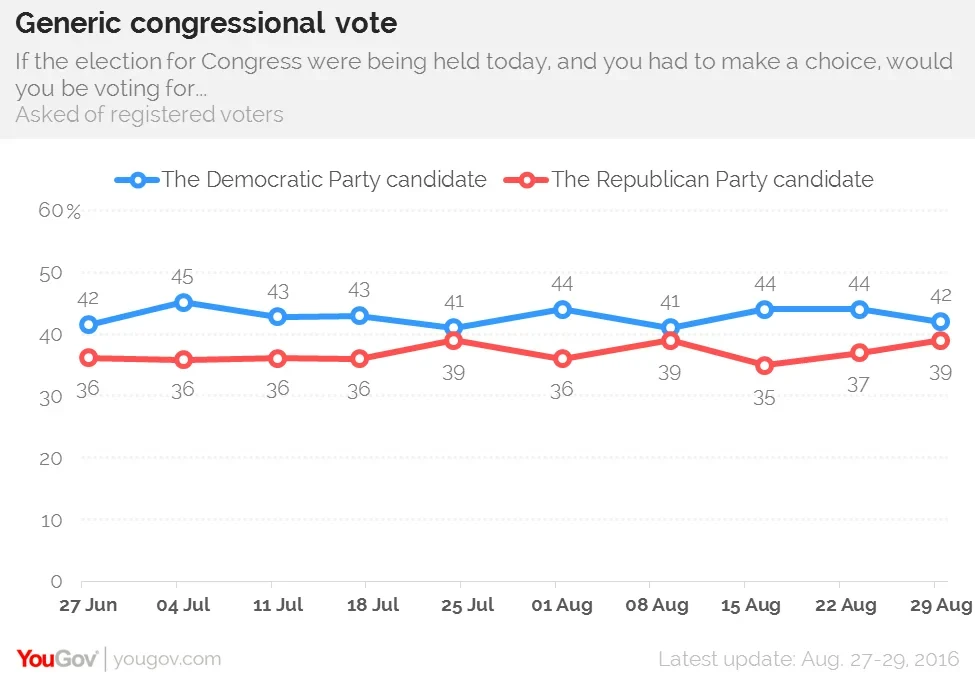
If the election for Congress were being held today, and you had to make a choice, would you be voting for...
- The Democratic Party candidate: 42% (-2)
- The Republican Party candidate: 39% (+2)
- Other: 2%
- Not sure: 15%
- I would not vote: 2%
Approval of Obama as president (among all adults):
- Approve: 50% (-2)
- Disapprove: 44% (-1)
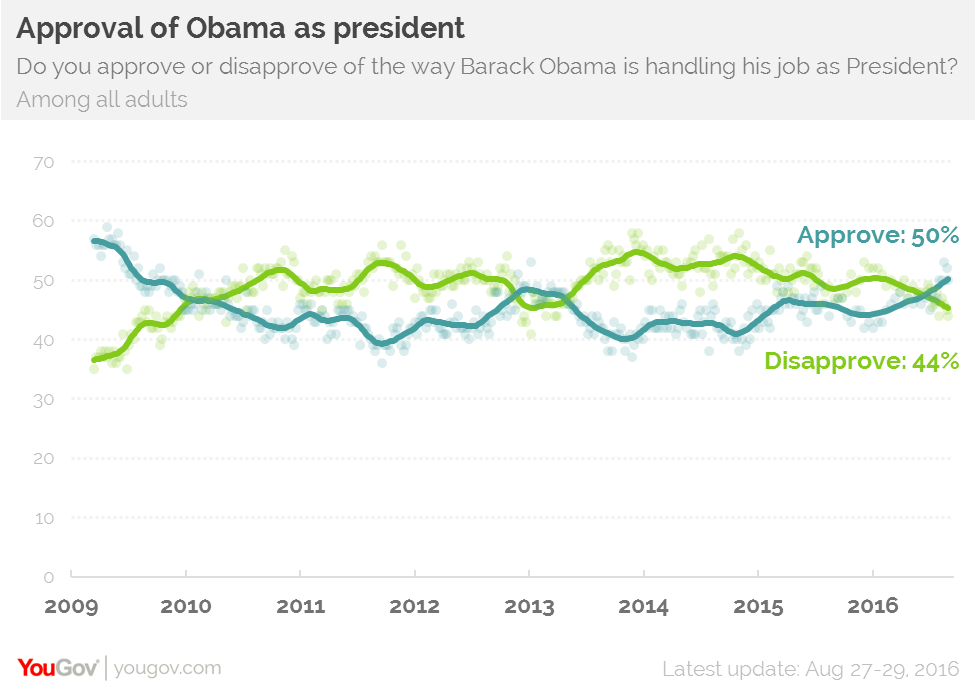
Among registered voters, 48% approve of Obama and 49% disapprove.
Approval of Congress:
- Approve: 10% (-2)
- Disapprove: 63% (+3)
Direction of the country:
- Right direction: 25% (-4)
- Wrong Track: 65% (+4)
Voter outreach
- Overall, 45% say Hillary Clinton "cares about the needs and problems of people like [me]", and 40% say the same for Trump. Majorities say Clinton (51%) and Trump (56%) don't care much at all.
- 52% of Americans think Hillary Clinton cares at least some about the needs and problems of black people, compared to 36% for Donald Trump. Among African-Americans, 72% say Clinton cares and 15% say Trump cares
- 50% of African-Americans also say Hillary Clinton "really means it" when she talks about trying to improve the lives of African-Americans, and she is not "just trying to win votes" (20%). For Donald Trump, only 3% of blacks think he means it and 80% think he's pandering. Whites, however, are slightly more likely to say Trump "really means it" (27%) than for Clinton (21%).
- 24% would describe Clinton as "bigoted" and 21% would describe her as "racist". For Trump, it's 47% "bigoted" and 51% "racist"
Immigration
- 40% have confidence in Hillary Clinton to deal wisely with immigration, compared to 33% for Donald Trump
- 47% say illegal immigration is a "very serious problem" in the United States, but only 17% say the same for their local community
- 46% of Americans think illegal immigrants should be allowed to stay and eventually apply for citizenship; 16% want legalization without citizenship; 37% think they should be required to leave the US
- By 36% to 25% Americans trust the Democratic Party over the Republican Party on immigration, but 24% trust neither and only 3% trust both
- 57% say Donald Trump has been "inconsistent" on immigration policy; 54% say Clinton has been "consistent".
Clinton Foundation
- Asked "regardless of your feelings about the Clintons themselves" 35% have a favorable opinion of the Clinton Foundation, while 42% have an unfavorable opinion. In May 2015 the numbers were reversed: 45% were favorable to the foundation and 30% were unfavorable.
- By 49% to 18% Americans believe the Clintons have personally profited from the Clinton Foundation, with 34% unsure.
- Asked what should happen to the foundation if Clinton wins in November, 11% say it should keep operating as is; 23% want it kept operating, but not taking foreign or corporate donations; and 33% want it shut down entirely.
Additional questions on conspiracy theories, the Rio Olympic Games, and the Zika virus can be found in the PDFs below.
Additional questions and detailed demographic breakdowns: PDF
Topline summary: PDF
National Tracking Report: PDF