This is a summary of a YouGov/Economist Poll conducted September 22-24, 2016. The sample is 1300 general population respondents with a Margin of Error of ±3.9% (3.8% for 948 registered voters).
GENERAL ELECTION (among registered voters):
If the 2016 presidential election were being held today and the candidates were Hillary Clinton, the Democrat, Donald Trump, the Republican, Gary Johnson, the Libertarian, and Jill Stein, from the Green Party, who would you vote for?
- Hillary Clinton: 44% (+4)
- Donald Trump: 41% (+3)
- Gary Johnson: 5% (-2)
- Jill Stein: 2% (0)
- Someone else: 1%
- Not sure yet: 5%
- Probably won't vote: 2%
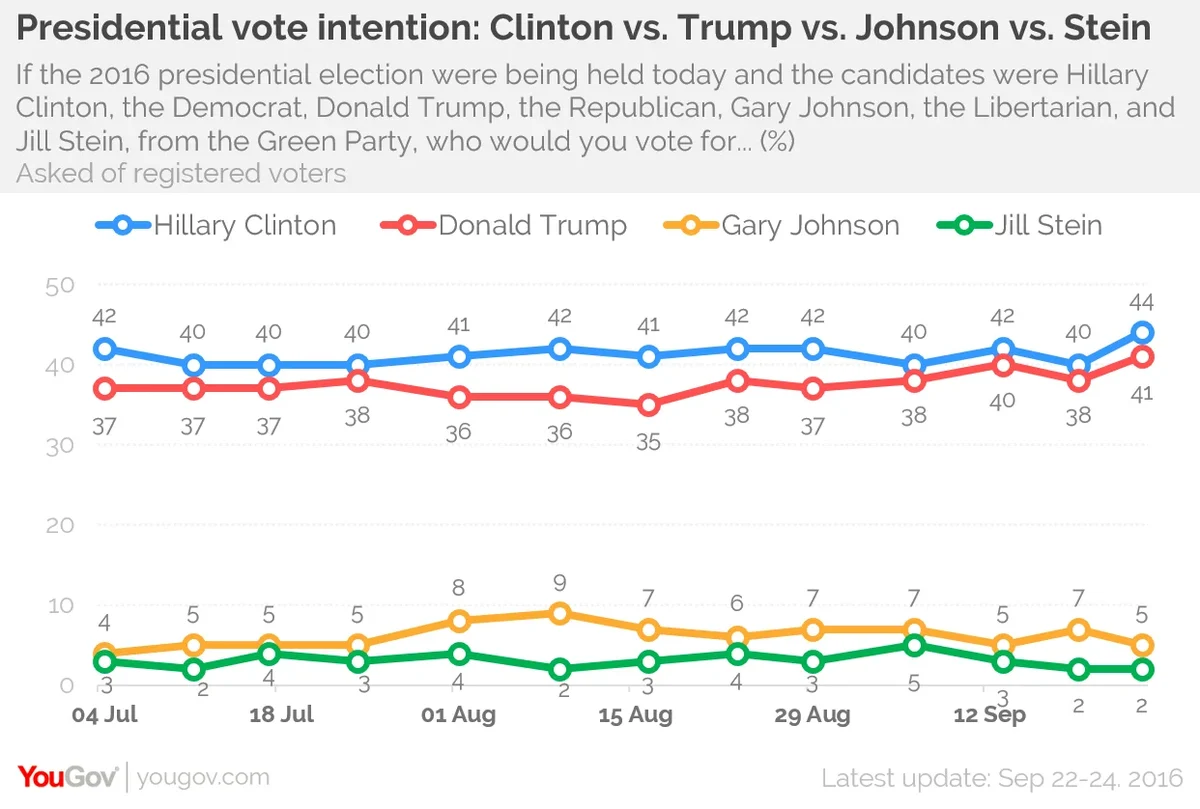
At 44% and 41% both Clinton and Trump have reached new highs in support since the introduction of the 4-way presidential ballot question.
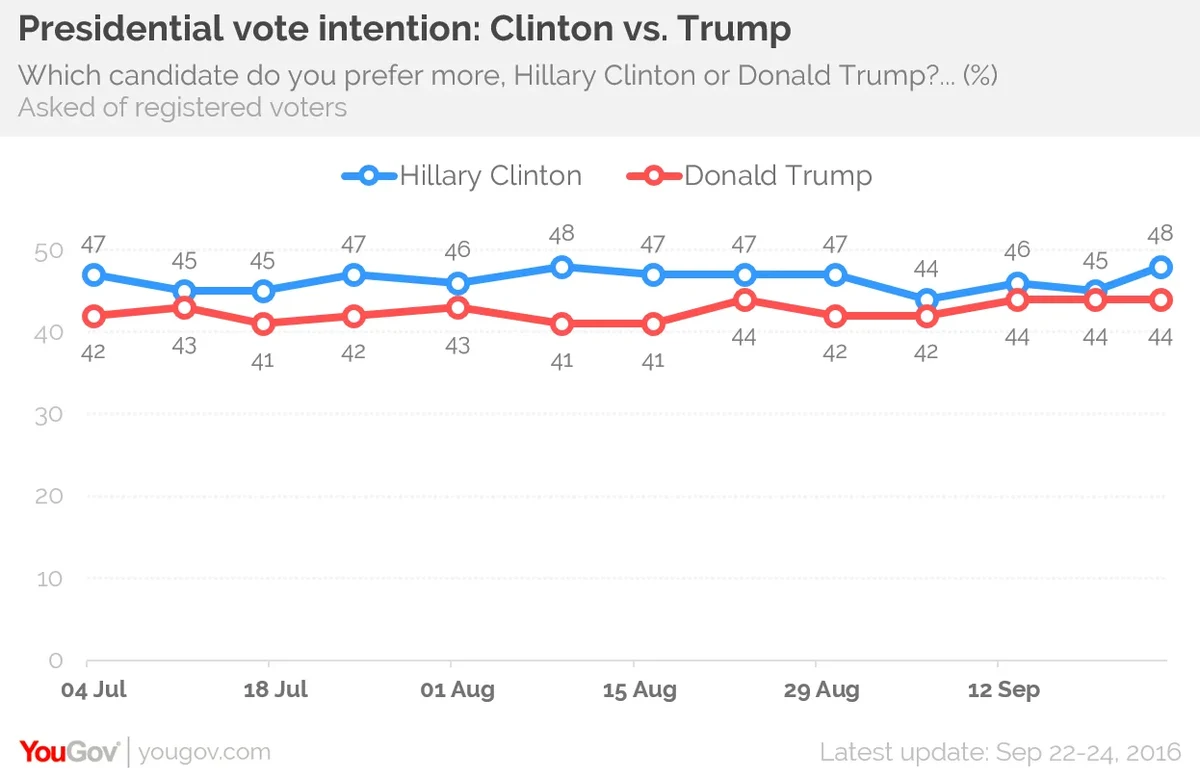
2-way follow-up: Respondents who selected Gary Johnson, Jill Stein, or ’someone else’ were asked the following question ’Which candidate do you prefer more, Hillary Clinton or Donald Trump?’ Below those responses have been added to the support for Clinton and Trump from the initial question.
- Hillary Clinton: 48% (+3)
- Donald Trump: 44% (0)
- Someone else / Not sure yet / No preference: 7%
- Probably won't vote: 2%
What do you think is the most likely outcome of the presidential election with Hillary Clinton as the Democratic nominee and Donald Trump as the Republican nominee?
- Clinton will win in a landslide: 15% (-1)
- Clinton will win narrowly: 35% (+2)
- Trump will win narrowly: 23% (0)
- Trump will win in a landslide: 9% (0)
- Not sure: 18% (-2)
\
Hillary Clinton favorability (among all adults):
- Favorable: 42% (-2)
- Unfavorable: 57% (+3)
Donald Trump favorability (among all adults):
- Favorable: 35% (-1)
- Unfavorable: 63% (+3)
Among registered voters, Trump and Clinton are more evenly matched in favorability: 42-58 for Clinton and 39-59 for Trump.
CONGRESS (among registered voters):
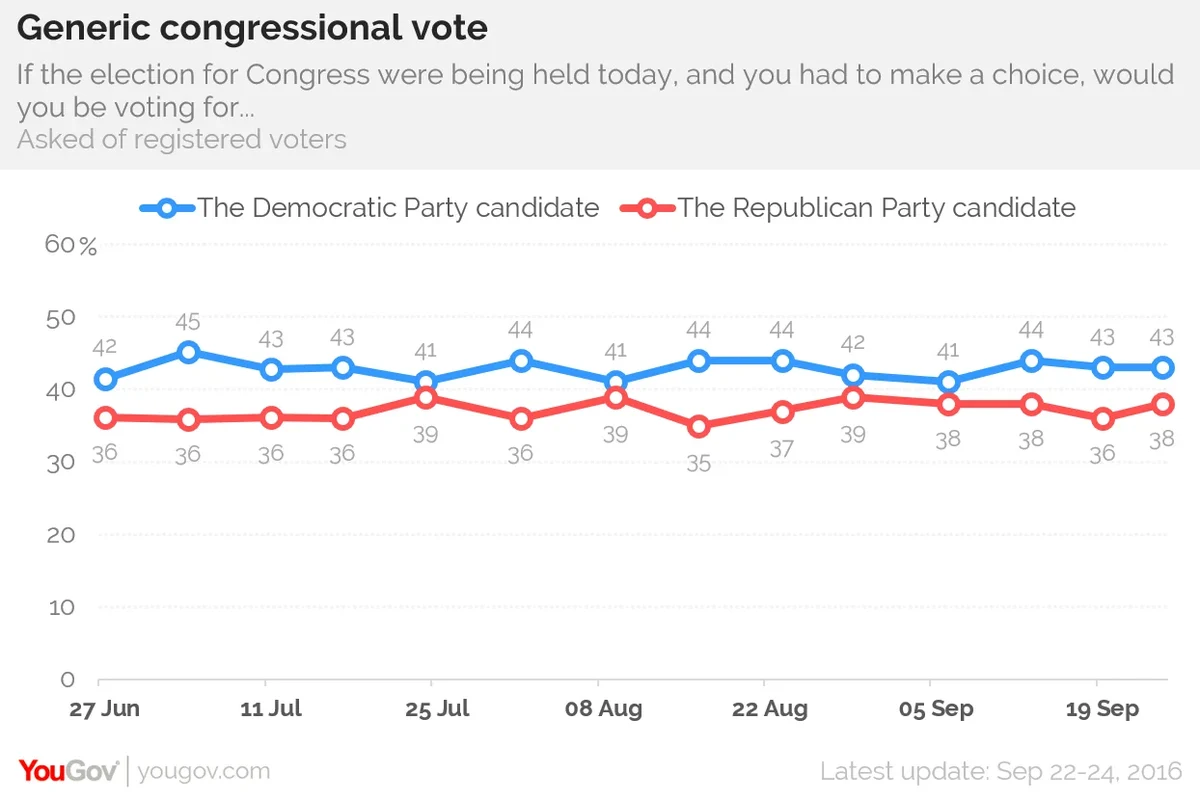
If the election for Congress were being held today, and you had to make a choice, would you be voting for...
- The Democratic Party candidate: 43% (0)
- The Republican Party candidate: 38% (+2)
- Other: 2%
- Not sure: 13%
- I would not vote: 3%
Approval of Obama as president (among all adults):
- Approve: 53% (+7)
- Disapprove: 45% (-4)
Among registered voters, 50% approve of Obama and 49% disapprove.
Approval of Congress:
- Approve: 13% (+3)
- Disapprove: 61% (-2)
Direction of the country:
- Right direction: 25% (-4)
- Wrong Track: 65% (+4)
Additional questions and detailed demographic breakdowns: PDF
Topline summary: PDF
National Tracking Report: PDF