In our final pre-election poll for The Economist, we found that 52% of likely voters said they intended to vote for Republican Congressional candidates, versus only 45% for Democratic Congressional candidates. Not since 1994, when the final Gallup poll showed Republicans with a 51-44 edge, have Democratic prospects been so bleak.
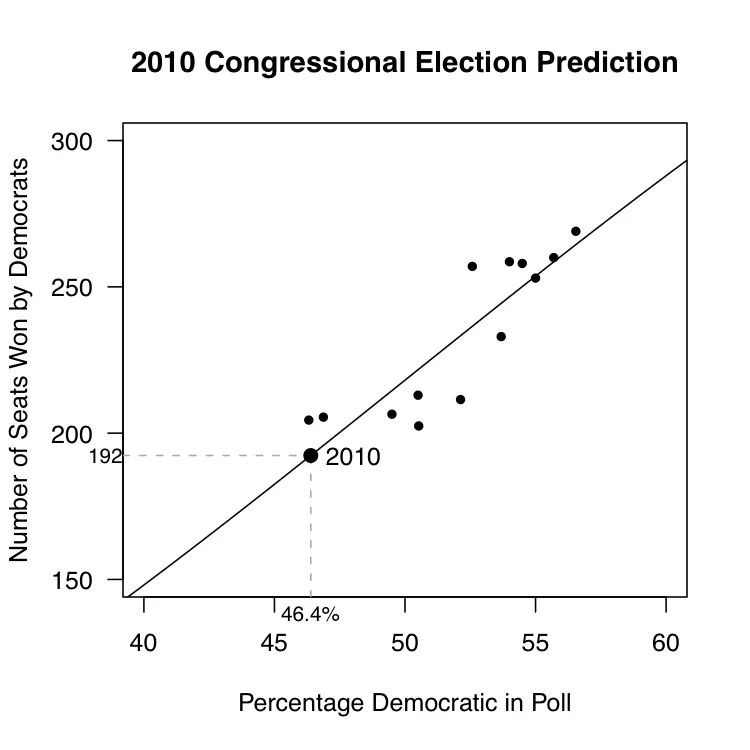
The Gallup Organization has the longest history polling midterm elections. In the scatterplot below, we show the percentage of likely voters in Gallup’s final pre-election poll intending to vote Democratic and the number of seats won by Democrats. (In calculating the percentage intending to vote Democratic, we have omitted undecideds and third party voters.) We then fit a regression equation which can be used to translate the final poll results into a seat forecast, as shown in the figure.

Our final pre-election poll has Democrats at 46.4% of major party voters (45/(45+52)). This translates into 192 seats for the Democrats—a loss of 63 seats for the Democrats from their current 255 seats, which would, by any reasonable standard, qualify as a “tsunami.” If this seems bleak, we should note that the final Gallup poll, released on October 31, 2010, showed Republicans leading by a 55-40 margin. This would translate into 162 seats or a 93 seat loss for Democrats. We do not believe that the Gallup polling is accurate, but it does indicate how severely the tides have turned against Democrats in the past year.
We should caution, however, that using a national poll to forecast seat changes is subject to large potential errors. The poll estimate of voting intentions has a margin of error of plus or minus 2.7 percent. Further, even if the poll estimate is exact, the seats-votes model prediction has a a 95% confidence interval that ranges from 159 to 227 Democratic seats.
Methodology
Interviews with 2500 general population respondents, including 2004 registered and 1634 likely voters, were conducted October 28-November 1, 2010. The tracking estimates are based on interviews with 1000 general population respondents that were conducted weekly from January 2009 through November 1, 2010, online using YouGov’s PollingPoint panel. YouGov uses a matched sample methodology that selects respondents to match the national registered voter population in terms of demographics (age, race, gender, education, employ- ment status, income, marital status, children), past voting behavior, and political attitudes (interest in politics, party registration, and ideology). The margin of error for this week’s poll numbers is ± 2.3%.


