

Part of a series on YouGov survey methodology showing how we do our polling work and how to interpret our polling data.
When YouGov surveys Americans, we aim to ask questions that accurately measure their beliefs, expectations, and behaviors. How we ask these questions can affect how survey takers respond. The choices we make about the number of response options we allow respondents to select from, the order in which we present those options, and how we word our questions can at times result in very different estimates of public opinion.
For example, people conducting surveys often want to gauge public opinion on a set of related topics and must choose between a variety of methods to do so. Researchers might ask about each item in a separate question, with respondents having the option to answer “yes” or “no” to each. ("Have you ever done this thing?") Another common method involves showing survey respondents a list of all the items, allowing them to select multiple items on the list, and directing them to “select all that apply.” ("Have you ever done any of these things? Select all that apply.")
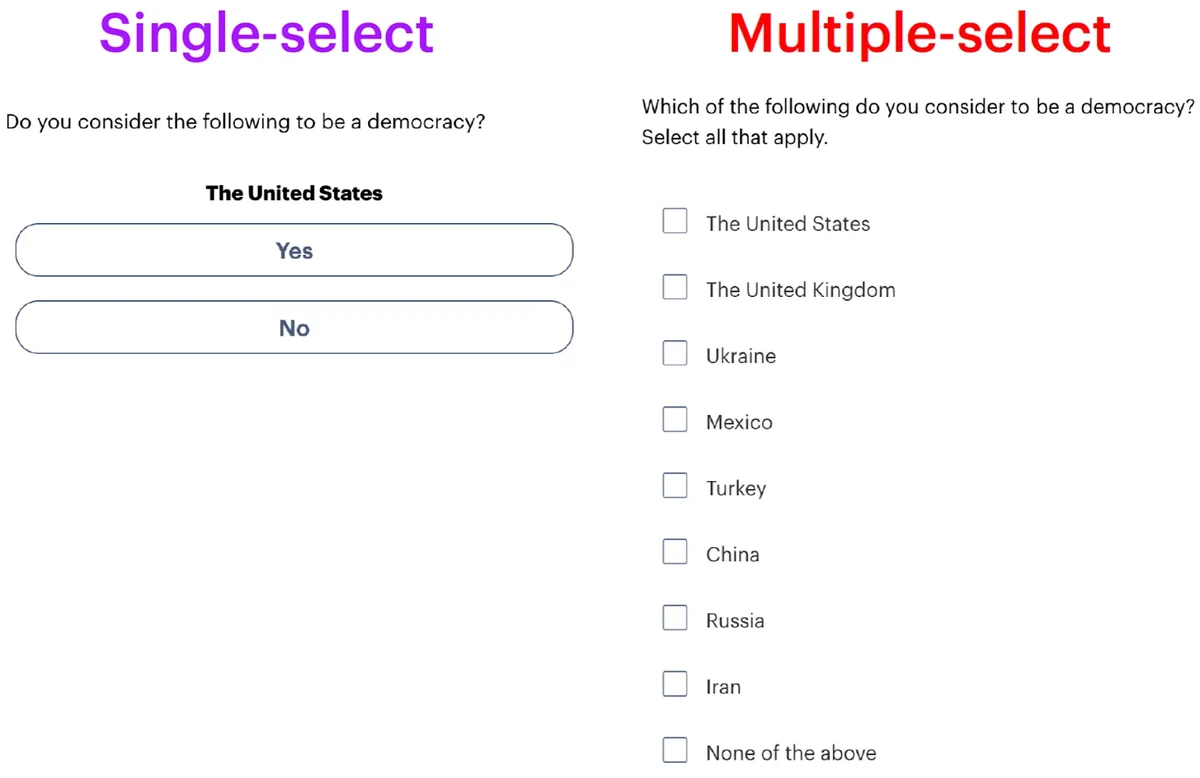
These are really two different ways of asking about the same information. In one, respondents are asked to consider all options at once and identify each one that applies. In the other, they are presented one option at a time, in turn, and say affirmatively when one doesn't apply rather than just omitting it. These two approaches often yield different results. Past studies have found that respondents select more list items when they are each shown in separate questions instead of in a single list.
There are potential benefits and drawbacks to each method. Multiple-select formats where respondents see all list items in a single question take up less space on surveys and are faster for respondents to answer. However, because respondents have to consider all the list items simultaneously, they may take more cognitive effort and attention to answer. Single-select formats — where respondents see each option in a separate question — take more time to ask and answer —but respondents can consider each choice separately on its own merits.
How likely people are to say something applies to them depends on how they are asked
Researchers at YouGov often use multiple-select formats to ask if something applies to different groups of people — for example, by asking a respondent if they, a member of their family, or a friend have ever tested positive for the coronavirus. This allows us to collect multiple pieces of information in a single question rather than asking separately about the status of each person. A potential concern with this format is that respondents could be less likely to say something applies to them personally if they are asked in a list rather than a single-select format.
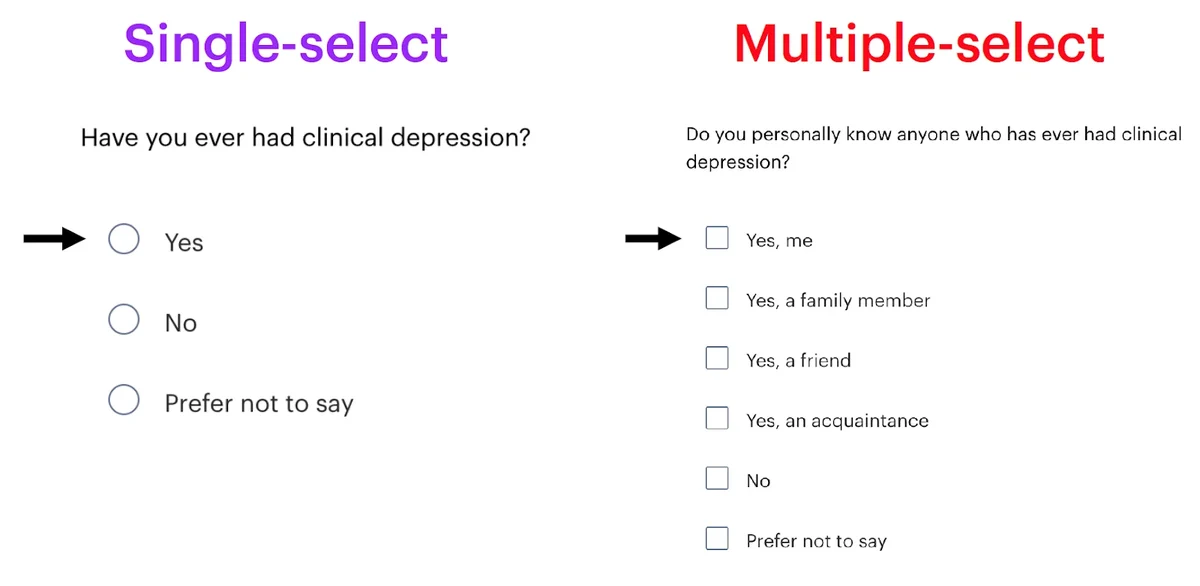
YouGov recently conducted an experiment to test whether question format affects survey estimates in these types of instances. We asked respondents about various experiences and identities, such as whether they are vegetarian, have ever tested positive for coronavirus, or have ever run for political office. We also asked whether each applies to certain groups of people they know. Half of the respondents saw the questions separately and could answer yes or no to each one. The other half of respondents saw each question in a list and were asked to select all that apply: Do they know anyone to whom an experience or identity applies, including themselves, their family, their friends, and their acquaintances? For example, these respondents were asked, “Do you personally know anyone who has ever had clinical depression? Select all that apply.” And they could select any of “Yes, me,” “Yes, a family member,” “Yes, a friend,” “Yes, an acquaintance,” “No,” and “Prefer not to say.”
Generally, Americans are more likely to say yes to single-select questions than to multiple-select questions. The median difference in resulting estimates of a dozen experiences and identities of Americans is 4 percentage points. The largest format difference occurred when we asked Americans if they had ever owned a smartphone. While a single-select question results in an estimate that 90% of U.S. adult citizens have ever owned a smartphone, the equivalent estimate from a multiple-select question is only 75%, based on results when Americans are asked about themselves and others they know, all in one question. The single-select estimate is closer to phone ownership data from the U.S. Census and other public opinion surveys than the multiple-select estimate.
There also are large differences between results from single-select and multiple-select questions for whether Americans have ever tested positive for coronavirus (34% vs. 28%), have ever had clinical depression (24% vs. 17%), and have ever been homeless (19% vs. 12%). However, there are no distinguishable differences between formats for the experiences and identities Americans were least likely to say they have. For example, single-select (6%) and multiple-select (5%) questions produce roughly equal estimates of the share of Americans who say they are vegetarian.
Comparing single-select to multiple-select lists
To compare asking Americans about a set of behaviors, each in separate questions, to a single list from which they can select all that apply, YouGov conducted another experiment asking Americans which of a set of 12 drinks — including both alcoholic and non-alcoholic ones they have ever tried. Half of the respondents were shown all 12 drinks in one list and were asked to select each drink they had ever tried, while the other half were asked if they had tried each drink in a separate question and could answer yes or no to each one.
As with the experience and identity questions, Americans shown each drink in a separate question were more likely to say they had tried them than were Americans who were shown all 12 drinks in the same multiple-select question. For example, Americans in the single-select group (84%) were 10 percentage points more likely than those in the multiple-select group (74%) to say they had ever tried wine. There were similar differences in the estimates of adults who have tried drinks derived from single-select and multiple-select questions for beer (80% vs. 72%), liquor (80% vs. 69%), and champagne (76% vs. 64%).
Americans also answered differently across formats for common non-alcoholic drinks. Estimates based on responses from single-select questions were 11 percentage points higher for having ever had orange juice than from multiple-select questions and 8 points higher for milk. However, the order of drink options from most to least tried is relatively consistent across the two question formats.
Even when public opinion estimates differ across question formats, it is often difficult to tell which is correct because of a lack of reliable baseline estimates — even if 96% seems like a more reasonable estimate of the percentage of Americans who have tried soda than 87%. However, the drinks experiment also asked Americans if they had tried water, and we can use this question to assess accuracy because all responses to this question should have been affirmative.
The single-select question found that nearly all (99%) Americans say they have tried water, while the estimate from the multiple-select question is only 93%. The single-select format is clearly more accurate for the water question, with the multiple-select question being 6 points less likely to produce accurate answers about ever having had water. While we do not have a clear baseline for the other 11 drinks, this difference does support past findings that single-select question formats often are more accurate.
Format changes also have different effects on estimates by age group. Adults under 30 are much more likely than older Americans to say they have never tried water. The single-select format finds that 4% of adults under 30 don't say they have had water, compared to 1% of Americans between 30 and 44 and 0% of older adults.
These differences are much larger in the multiple-select format, which finds that 16% of adults under 30 say they have never tried water, as do 11% between ages 30 and 44 and 2% of older adults. Younger adults are more likely than older ones to say they have never tried water, and the difference is larger in results from multiple-select questions.
Pollsters take different approaches when choosing between single-select and multiple-select question formats. The Pew Research Center, for example, uses the single-select format whenever possible because their experiments have shown that respondents shown multiple-select questions are less likely to say they have behaviors and attitudes that they do have. That is, they do not answer questions affirmatively even when they should. At YouGov, we use experiments such as those described in this article to inform our approaches when possible.
— Taylor Orth and Carl Bialik contributed to this article
Related:
See the results for the April 14 - 21, 2023 and July 20 - 28, 2023 YouGov polls
Methodology: The two YouGov polls were conducted online. One was conducted among 2,000 U.S. adult citizens on two separate surveys from July 20 – 26, 2023 and July 21 – 28, 2023. The other was conducted among 1,000 U.S. adult citizens on April 14 - 21, 2023. For each poll, respondents were selected from YouGov’s opt-in panel using sample matching. A random sample (stratified by gender, age, race, education, geographic region, and voter registration) was selected from the 2019 American Community Survey. For each poll, the sample was weighted according to gender, age, race, education, 2020 election turnout and presidential vote, and current voter registration status. Demographic weighting targets come from the 2019 American Community Survey. The sample also was weighted by baseline party identification, which is the respondent’s most recent answer given prior to March 15, 2022, and is weighted to the estimated distribution at that time (33% Democratic, 28% Republican). The margin of error for the overall sample on each poll is approximately 3%.
Image: Adobe Stock (onephoto)