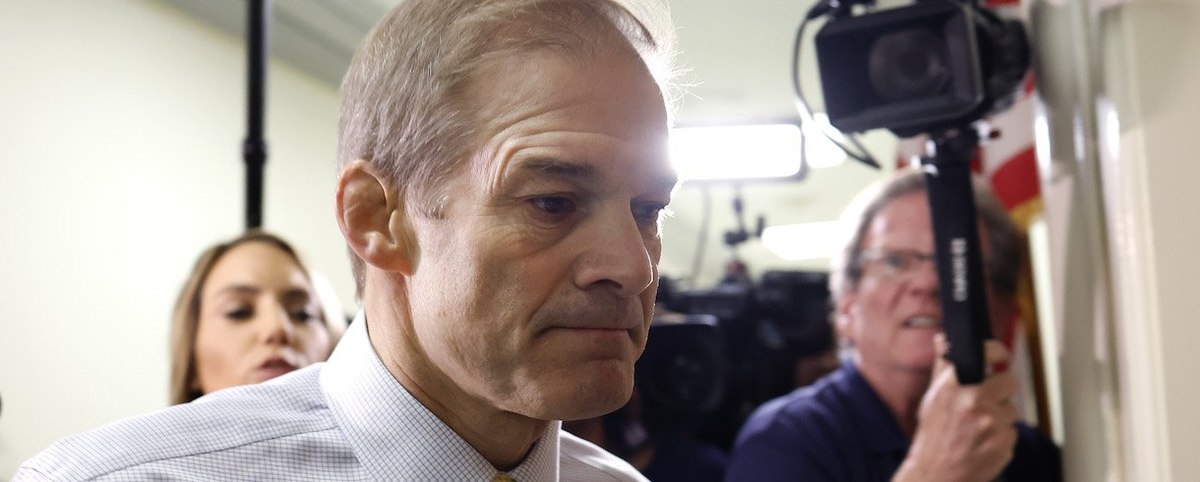


Rep. Jim Jordan is the top pick for speaker of the House of Representatives among Americans who identify with or lean toward the Republican Party, but he is far from a consensus pick. With the country now in its second week without a House speaker, the Ohio Representative — who has fallen short in two House votes so far — has three times more support for speaker than any other possible candidate polled about among Republicans and Republican leaners. But only 37% of this pro-Republican group want Jordan as speaker; 31% want someone else and 32% are unsure.
Jordan has stronger support among the 51% of Republicans and Republican leaners who would prefer a speaker who sticks to their principles than among the 34% who would prefer a speaker who compromises. He has support from 46% of those preferring a speaker who sticks to their principles, compared to 29% of those who would prefer a speaker who compromises.
The group who would prefer a compromising speaker is less likely to support Donald Trump for speaker and more likely to support three other possible candidates: Speaker Pro Tempore Patrick McHenry, Democratic Minority Leader Hakeem Jeffries, and the previous speaker, Kevin McCarthy.
Some Republicans have soured on the Oct. 3 decision to remove Kevin McCarthy as speaker, according to this week's Economist/YouGov poll. Republicans now are more likely to strongly or somewhat disapprove of McCarthy's removal than to approve, whereas the prior week's poll found Republicans evenly split.
Even though more Republicans now regret removing McCarthy, the former speaker remains relatively unpopular. Among prominent House Republicans, Jordan (54%) and prior candidate Steve Scalise (48%) both are approved of at least somewhat by more Republicans than McCarthy is (43%).
Americans are far more likely to think the lack of a House speaker is hurting the U.S. government's ability to govern than to think it is helping. About half (51%) say it has hurt the government’s ability to function, while only 22% say it is having no effect and 5% say it is helping. Opinions are similar among Democrats and Republicans.
Far more Americans continue to view the Democratic Party as the more united political party than to say the same about the Republican Party, by a margin of 51% to 16%. On this question of unity and division, Republicans are divided: 33% say Democrats are more united and 40% say Republicans are.
Congress as a whole is broadly unpopular among Americans: 16% strongly or somewhat approve of the way it is handling its job, and 15% neither approve nor disapprove. Meanwhile 41% approve of President Biden's job performance and 37% approve of the Supreme Court's.
Americans are particularly negative about Republicans in Congress. Only 32% now have a strongly or somewhat favorable opinion of congressional Republicans while 57% have an unfavorable view of them. The Democrats in Congress are also unpopular, but less so: 42% of Americans are very or somewhat favorable to them while 48% are not.
Congressional upheaval and the more favorable views of Democrats in Congress than Republicans doesn't appear to extend to views of the 2024 presidential election, barely a year away. The hypothetical matchup between President Joe Biden and Trump continues to look like a very close one. This week's poll finds that 43% of registered voters would vote for Biden and 42% would vote for Trump.
See the toplines and crosstabs from the Economist/YouGov poll conducted on October 14 - 17, 2023 among 1,500 U.S. adult citizens.
Methodology: Respondents were selected from YouGov’s opt-in panel using sample matching. A random sample (stratified by gender, age, race, education, geographic region, and voter registration) was selected from the 2019 American Community Survey. The sample was weighted according to gender, age, race, education, 2020 election turnout and presidential vote, baseline party identification, and current voter registration status. Demographic weighting targets come from the 2019 American Community Survey. Baseline party identification is the respondent’s most recent answer given prior to November 1, 2022, and is weighted to the estimated distribution at that time (33% Democratic, 31% Republican). The margin of error for the overall sample is approximately 3%.
Image: Getty (Anna Moneymaker)