
Ahead of the Fourth of July, YouGov asked Americans about the meaning of the holiday, their views on other Americans, and the American Dream. Many of these questions were first asked decades ago and pulled from the Roper Center Polling Archive, in order to compare how sentiments have changed in the past several decades. Among other findings, Americans are more satisfied with how democracy is working now than they were a year ago, but dissatisfaction is still much higher than it was when the question was first asked in 1997.
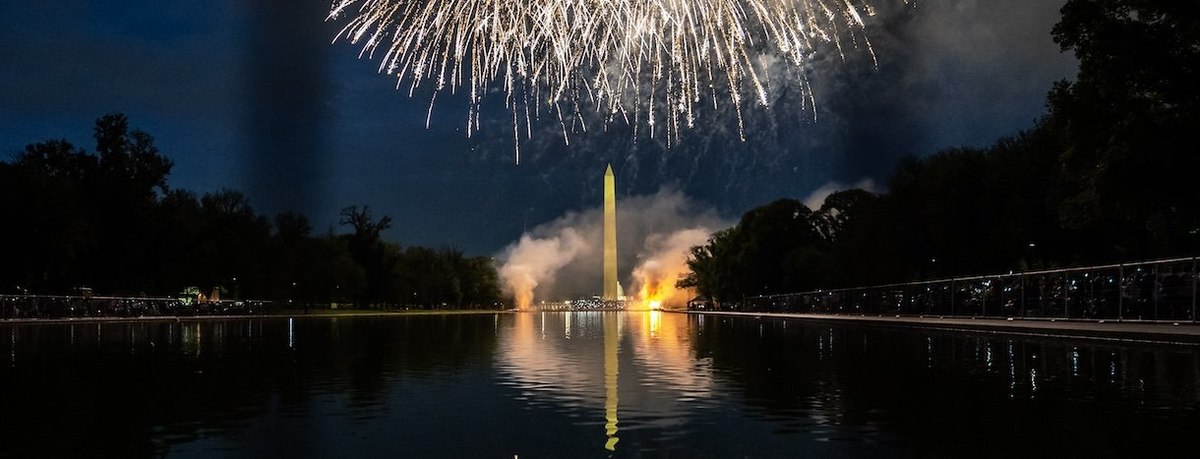
A 1983 Roper/ABC poll asked Americans whether they thought most people think of the Fourth of July as more a time for holiday fun and relaxation or more a time for thinking about the history and freedoms of this country. In 1983, 82% of Americans said most people saw the Fourth more as a time for fun and relaxation; in 2024, 60% agree. Now, 27% say most people see it as about both; then 7% did.
Another historical poll related to the Fourth of July is a 2001 poll from Gallup that asked Americans whether the use of fireworks by individuals should be made legal throughout the country. In 2001, 41% said it should be made legal while 56% said it should not be legal. In 2024, 41% say that the use of fireworks by individuals should be made legal while 35% think it should not be made legal. 24% are not sure. (The 2001 poll did not include a not sure option.) Republicans (50%) are more likely than Independents (38%) and Democrats (34%) to say the use of fireworks should be made legal.
Most Americans (56%) say they’re very proud to be an American while 27% are somewhat proud. 10% are not very proud to be an American and 3% are not at all proud to be Americans.
Republicans (74%) are more likely than Independents (43%) and Democrats (52%) to say they are very proud to be an American.
People 65 and older (73%) are more likely than younger adults to say they’re very proud to be an American — twice as likely as adults under 30 (37%).
Americans are more likely to report being proud to be American now than they were in 2020, when 48% said they were very proud to be American and 22% said they were somewhat proud.
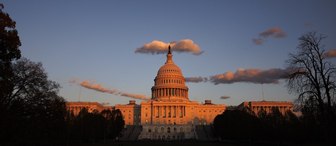
Are Americans satisfied with the way democracy is working? On a 0 to 10 scale, where 10 means “extremely satisfied,” 40% give the country a 6 or higher, including 6% who give it a 10 out of 10. 16% rate their satisfaction at a 5 out of 10. 30% of Americans choose a figure between 1 and 4, which is on the more dissatisfied end of the spectrum. 14% are “extremely dissatisfied” with how democracy is working in the U.S., giving a rating of 0.
About one-fifth (22%) of Republicans say they are extremely dissatisfied with how democracy is working in the U.S.
YouGov has asked this question, which is taken from a 1997 Gallup poll, since 2022. Within the last year, there has been a drop in the share of Americans who are extremely dissatisfied with the way democracy is working, from 21% in 2023 to 14% now. In 1997, when Gallup asked the question, just 3% of Americans were extremely dissatisfied with how democracy was working.
Americans hold a largely negative view of how most Americans are today. In the June 2024 survey, YouGov ran a question asked in a 1948 Fortune/Roper poll about the words people would use to describe “the way most Americans are today.” The most common choices among today’s Americans — within the set of options included in the poll question — are selfish (42%), spoiled (41%), and undisciplined (36%). Slightly fewer describe their fellow citizens as gullible (33%), intolerant (33%), or insecure (29%).
The words Americans are least likely to use in describing the way most Americans are today — among those provided — are disciplined (8%), imperialistic (8%), really democratic (10%), or moral (10%).
When the question was first asked in 1948, 50% said most Americans were generous and 35% said they were confident. Today, far fewer describe Americans as generous (12%) or confident (18%).
Slightly fewer described their fellow citizens as selfish, spoiled, and optimistic (28% for each).
Republicans are more likely than Democrats to say Americans today are selfish (44% vs. 37%), spoiled (49% vs. 32%), and undisciplined (44% vs. 24%). Democrats are more likely than Republicans to describe Americans today as hardheaded (30% vs. 25%), reactionary (28% vs. 21%), and confident (23% vs. 17%).
60% of Americans believe that there is such a thing as the American Dream, which, generally speaking, is the idea that every American has the freedom and opportunity to succeed and attain a better life. 23% say there is no such thing.
Republicans (68%) are more likely than Democrats (61%) and Independents (50%) to believe the American Dream exists. Americans 65 and older (66%) are more likely than younger adults to believe the American Dream exists. 30% of adults under 30 say there is no such thing as the American Dream, compared to 17% of Americans 65 and older.
There has been little change since last year in the share of Americans who believe in the American Dream, when 61% said there was such a thing. However, Democrats are now more likely to believe in the American Dream (61% do now vs. 56% in June 2023), while Republicans are less likely to (68% vs. 76%).
In 2024, Americans are more likely to believe the American Dream is attainable for them personally (40% say it’s very or somewhat attainable) than for most people (34%). Adults with annual family incomes of $100,000 or more are especially likely to believe that the American Dream is attainable for them personally (58%) and for most people (46%).
Among people with annual family incomes under $50,000, 29% believe the American Dream is attainable for them personally. 27% say the American Dream does not exist, 21% say they are not sure if the American Dream exists, and 19% say it is unattainable for them.
— Taylor Orth and Carl Bialik contributed to this article
Related:
- Which holidays do Americans enjoy most — and least?
- Polls from the Past: Democracy, Patriotism, and Trust in Other Americans
- Half of Americans say that Americans are becoming less patriotic
- Americans are far more likely to believe in the American Dream now than they were a year ago
- In 2022, do Americans believe in the 'American Dream'?
See the results for this YouGov poll
Methodology: This YouGov poll was conducted online on June 24 - 27, 2024 among 1,119 U.S. adult citizens. Respondents were selected from YouGov’s opt-in panel using sample matching. A random sample (stratified by gender, age, race, education, geographic region, and voter registration) was selected from the 2019 American Community Survey. The sample was weighted according to gender, age, race, education, 2020 election turnout and presidential vote, baseline party identification, and current voter registration status. Demographic weighting targets come from the 2019 American Community Survey. Baseline party identification is the respondent’s most recent answer given prior to November 1, 2022, and is weighted to the estimated distribution at that time (33% Democratic, 31% Republican). The margin of error for the overall sample in each survey is approximately 4%.
Image: Getty (Nathan Howard / Stringer)