This week’s Economist/YouGov poll covers the presidential election; the debate's aftermath; age and politicians; the Supreme Court; British leaders; flags on the Fourth; and weather and climate.
The presidential election
- After Donald Trump was perceived by most Americans to have won his first debate against President Joe Biden, voter preference has shifted a little, but the race is still close: 42% of registered voters say they will vote for Trump, 40% for Biden
- In last week's poll, the race was tied at 42% each
- Among registered voters, 86% of Democrats support Biden while 90% of Republicans support Trump
- Trump leads among Independents who are registered voters, by 35% to 27%; 10% support Robert F. Kennedy, Jr.
- 89% of Biden supporters and 93% of Trump supporters say their minds will not change
- Nearly half (46%) of supporters of someone besides Biden and Trump — including Kennedy, Jill Stein, and Cornel West — say they could change their mind
- Nearly one in three Democrats and Independents who lean Democratic believe Biden should withdraw from the race, as do 19% of Biden supporters
- Registered voters who are currently undecided — who say they would not vote or are unsure — don’t appear to be moved by either candidate: Majorities say they would be more likely to vote for a different Democrat or a different Republican than for Biden or Trump, respectively
- Registered voters have not warmed to Vice President Kamala Harris, seen as the most likely Democratic nominee if Biden withdraws: 51% of registered voters say she does not have the qualifications to serve as president should that become necessary, while 38% say she does
- Trump supporters are 22 percentage points more likely than Biden voters to be extremely or very enthusiastic about voting this year — a gap that widened significantly in the aftermath of the debate, from 9 points in the previous week's survey
- More registered voters see Biden as honest and trustworthy (42%) than think that about Trump (34%), but by 12 points more are confident about Trump’s handling of an international crisis: 44% say they are confident in Trump, compared with 33% for Biden
- Registered voters are about equally likely to say they agree more with Biden on the issues than more with Trump (45% say each)
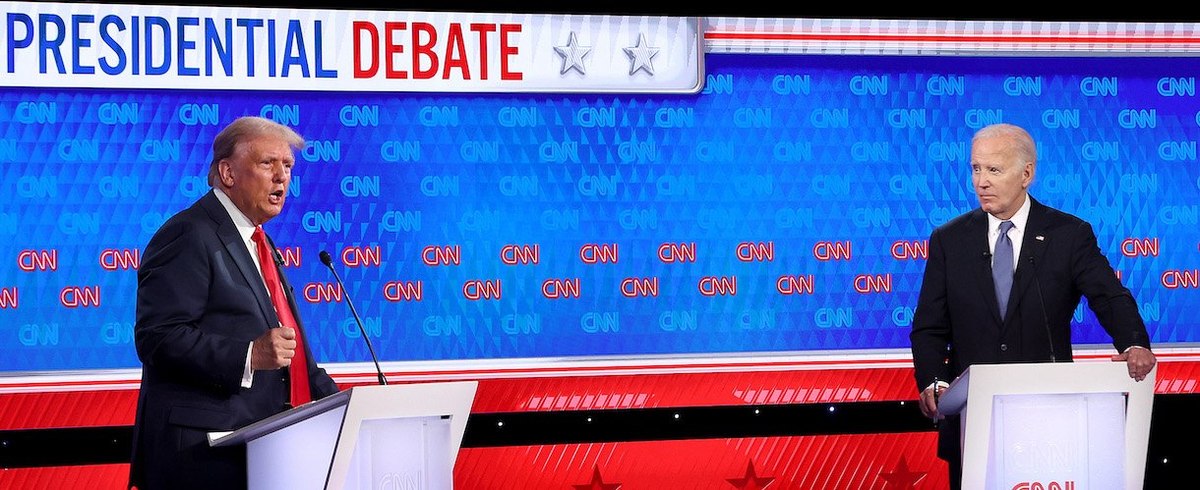
The debate's aftermath
- Last week’s presidential debate was not a good experience for many Americans: about one-third (35%) say the debate made them feel annoyed, and nearly as many (32%) were left anxious
- About one-quarter of Americans say the debate made them feel each of the following: angry (27%) and pessimistic (26%)
- 14% say they did not hear anything about the debate
- Biden supporters are especially likely to feel anxious and pessimistic about the debate
- One-third (33%) of Trump supporters are annoyed, though about one-quarter (23%) were entertained, and one in five (19%) are optimistic
- Debate viewership was much higher among Trump supporters than among Biden supporters: 35% of Biden supporters watched it all, compared with 58% of Trump supporters
- Trump was seen as the winner of the debate, by a margin of 46% to 11% among all Americans
- Only one-third (32%) of Biden supporters say their candidate won; 16% say Trump did and the rest aren’t sure, say it was a tie, or haven't heard anything about the debate
- More Americans say Biden was more truthful than say Trump was (35% vs. 29%); more say Trump attacked his opponent more (32% to 17%)
Age and politicians
- Six in ten registered voters (62%) say Biden’s age and health would severely limit his ability to do the job of president if he were re-elected
- Only 12% of registered voters who say Biden’s age and health would severely limit his ability to do the job of president if he were re-elected plan to vote for him; 66% would vote for Trump
- Older registered voters are no different than younger ones in their concern about Biden’s age and health placing limitations on his job performance: 60% who are under 30 say so, as do 65% who are 65 or older
- Only about one-quarter (27%) of registered voters say Trump’s age and health would severely limit his ability to do the job of president if elected
- Large majorities of both Biden supporters and Trump supporters believe there should be mandatory mental competence tests for politicians older than 75, with results released to the public
- 74% of Americans older than 75 agree
The Supreme Court
- Just 36% of Americans strongly or somewhat approve of how the U.S. Supreme Court is handling its job, while 48% disapprove
- This disapproval is driven by Democrats, just 25% of whom approve of the court, which has six Republican appointees and three Democratic appointees; 62% of Republicans approve of the court
- The court's recent decision in Loper Bright Enterprises v. Raimondo overturned a 1984 precedent that courts should defer to administrative agencies in interpreting unclear laws
- Americans are nearly evenly split on the issue, with 51% saying courts should defer to agencies and their subject matter experts, while 49% say courts should not defer
- Most Democrats say courts should defer to administrative agencies while most Republicans say they should not
British leaders
- Just ahead of the UK election on July 4, majorities of Americans have no opinion of Rishi Sunak, Keir Starmer, and Nigel Farage
- Opinion of Sunak, where it exists, is mostly negative: 11% view him very or somewhat favorably, and 21% unfavorably
- Opinion of Starmer is roughly evenly divided, as is opinion of Farage
Flags on the Fourth
- For most Americans, July 4 will be a day to relax, be with family, watch television or see some fireworks
- More than four in 10 (42%) say they will fly the flag on the Fourth, including 27% who say they fly the flag every day
- Republicans are more likely than Democrats to say they fly the flag; flying the flag is more popular in rural areas than in cities, and more popular in the Northeast than in other regions
- Nearly four in 10 (39%) say they are personally very patriotic; just half that percentage (20%) think most Americans are very patriotic
- Trump supporters are more than twice as likely as Biden supporters to call themselves very patriotic (68% vs. 29%); they also are more likely to say Americans are becoming less patriotic (63% to 37%)
- Three-quarters (75%) of Americans enjoy fireworks — including 73% of dog owners
Weather and climate
- More than half of Americans (59%) expect summer to be hotter this year than usual; at least 51% in all four major regions agree
- Expected heat partially reflects politics: Biden supporters are more than twice as likely as Trump supporters to foresee a hotter than usual summer in their local area (80% vs. 36%)
- The political division remains when it comes to the belief in climate change: nearly all Biden supporters (88%) see climate change caused by human activity as happening, compared to 25% of Trump supporters
- Another 45% of Trump supporters say there has been climate change, but do not believe humans have any responsibility for it
— Carl Bialik contributed to this article
See the toplines and crosstabs for the June 30 - July 2, 2024 Economist/YouGov Poll
Methodology: The poll was conducted among 1,608 U.S. adult citizens from June 30 - July 2, 2024. Respondents were selected from YouGov’s opt-in panel to be representative of U.S. adult citizens. A random sample (stratified by gender, age, race, education, geographic region, and voter registration) was selected from the 2019 American Community Survey. The sample was weighted according to gender, age, race, education, 2020 election turnout and presidential vote, baseline party identification, and current voter registration status. Demographic weighting targets come from the 2019 American Community Survey. Baseline party identification is the respondent’s most recent answer given prior to November 1, 2022, and is weighted to the estimated distribution at that time (33% Democratic, 31% Republican). The margin of error for the overall sample is approximately 3%.
Image: Getty


