Findings from the latest Economist/YouGov poll — now out each week a day earlier, on Tuesdays — about:
- Whether approval of Donald Trump has stabilized
- A new second-term low for one economic-opinion indicator
- How many Americans think the U.S. is a democracy
- Which changes to Catholic doctrine would be supported by majorities of Americans
Donald Trump
- More Americans disapprove than approve of Donald Trump's job performance (52% strongly or somewhat disapprove vs. 42% approve)
- Slightly fewer Americans disapprove of Trump than did so last week, when 54% disapproved
- This is the first week in more than a month in which Trump's disapproval isn't higher than on the prior weekly Economist / YouGov Poll
- Americans continue to be more likely to disapprove of Trump's handling of jobs and the economy: 41% approve and 51% disapprove, for a net approval of -10
- Trump's net approval on jobs and the economy is up slightly from last week, when 41% approved and 53% disapproved, but below how Americans rated Trump's handling of the economy or jobs and the economy at any time in his first term
- 49% of Americans say the U.S. economy is getting worse, down slightly from the 54% who said so last week, but much higher than the shares who say the economy is getting better (18%) or is about the same (26%)
- 30% of Americans expect their household finances to be better a year from now, the lowest share of Americans to say this since October 2024
American democracy
- More Americans say they're completely or somewhat dissatisfied with the way democracy is working in the U.S. than say they are satisfied (55% vs. 33%). Dissatisfaction with democracy is far more common among Democrats than among Republicans (77% vs. 32%)
- 58% of Americans believe the U.S. is currently a democracy, while 23% disagree. One in five (19%) believe the U.S. is a dictatorship and 60% say it is not
- More Americans agree than disagree that the U.S. has a robust system of checks and balances (47% vs. 29%)
- 54% of Americans believe the country is in a constitutional crisis. Of those who think we're in a constitutional crisis, 37% believe there is a robust system of checks and balances, while 42% believe there is not
- Half (52%) of Americans say that Donald Trump has not too much or no respect for this country's democratic institutions and traditions; 19% say he has a fair amount of respect and 21% say he has a great deal of respect. While most Republicans say Trump has at least some respect for the country's democratic institutions and traditions, only 49% say he has a great deal of it
- Of the three branches of the federal government, Americans are most likely to say that the executive branch currently is exercising too much power; 46% say it is, compared to 24% who say so about the judicial branch and 14% who say so about the legislative branch
- Majorities of Republicans think each branch is exercising about the right amount of power, including the executive branch (62%), the legislative branch (56%), and the judicial branch (53%)
- Most Democrats (69%) think the executive branch is exercising too much power. Democrats are more divided on the other branches; more say the legislative branch is exercising too little power than say it is exercising too much (37% vs. 10%)
- The vast majority of Americans (86%) strongly or somewhat support the ability of Americans to protest against what they see as unjust. 92% of Democrats and 80% of Republicans are supportive of Americans having this ability
- Nearly half (46%) of Americans say that there has been a political rally or protest in their local area in 2025, though only 7% say they have attended one. Democrats are significantly more likely than Republicans to say they've attended one (12% vs. 2%)
Government cuts
- Almost half (45%) of Americans think Trump administration cuts to the budgets and staff of federal agencies have gone too far; 26% think they've been about right and 16% think they haven't gone far enough. These results have changed little since mid-March, the last time this question was asked
- One-third (35%) of Americans say they personally know someone who has been affected by cuts in government agencies and programs. The share who say they do has increased 6 points since mid-March
- Net favorability of the Department of Government Efficiency (DOGE) is -8 (37% approve vs. 45% disapprove). DOGE associate Elon Musk's net favorability is -12 (42% vs. 54%)
- Net approval of Musk's handling of his job as a senior advisor to Trump is -16, which is significantly lower than approval of his handling of each of Musk's positions in the private sector
- 59% of Americans say they are very or somewhat concerned about Musk using DOGE to benefit his companies and personal interests; 32% are not too or not at all concerned
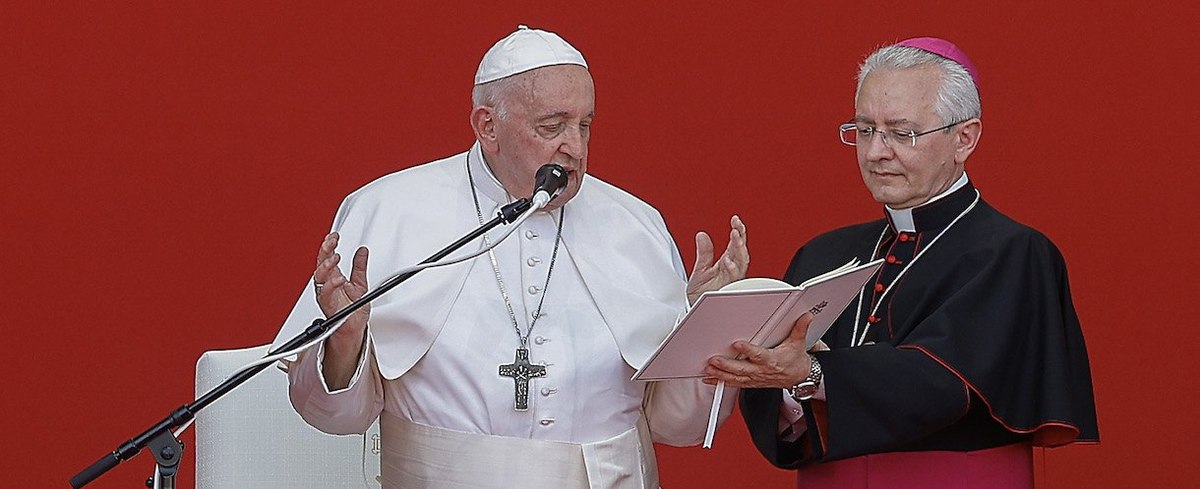
The Catholic Church
- More Americans have favorable than unfavorable opinions on the Catholic Church (46% vs. 32%), and the same is true for each of the three most recent popes
- Pope Francis is viewed most favorably of the three (+39 net favorability), followed by Pope John Paul II (+35) and Pope Benedict XVI (+18)
- Catholics have especially positive views of the recent popes: Francis (+67), John Paul (+76), and Benedict (+55)
- Francis' net favorability is far higher among Democrats than among Republicans (+65 vs. +21). Net favorability of Benedict among Democrats is slightly lower than among Republicans (+21 vs. +28), and members of both parties are similarly positive about John Paul (+41 vs. +41)
- Half (51%) of Americans think Pope Francis will be remembered as either a very good pope or one of the best popes; 16% think he will be remembered as average, and 9% think he will go down in history as a poor pope or one of the worst popes
- Pope Benedict XVI was viewed less fondly after his resignation in 2013: 15% thought he would be remembered as a very good pope or one of the best popes, 34% thought he would be considered average, and 16% thought he would go down in history as a poor pope or one of the worst popes
- While many Americans are unsure how to classify Pope Francis' political beliefs, more say that he was liberal than say he was conservative (34% vs. 9%). Evaluations of his ideology were similar in 2015, when we last asked (30% liberal vs. 12% conservative)
- Americans are divided on what they want the next pope's politics to be: 22% say they'd prefer a liberal pope, 24% a moderate one, and 20% a conservative one. Among Catholics, more prefer either a moderate (29%) or conservative (25%) pope than a liberal (19%)
- Americans are more likely to say it's appropriate than inappropriate (41% vs. 31%) for the pope to try to influence world affairs. Among Catholics, the margin of support is even higher (53% vs. 24%)
- More say it's inappropriate (42%) than appropriate (34%) for the pope to try to influence domestic affairs in the U.S.
- 57% of Americans think the pope has at least some influence on U.S. domestic affairs, including only 6% who say he has a great deal of influence
- In 2015, the last time we asked about papal influence in the U.S., more Americans said the pope was influencing U.S. affairs a great deal than say so now (71% vs. 57%)
- Most Americans — including most Catholics — support the Catholic Church permitting abortion in some cases (63% of Americans; 65% of Catholics), divorce (62%; 58%), marriage by priests (62%; 54%), and artificial means of birth control (62%; 52%)
- 54% of Americans and nearly half (47%) of Catholics support allowing women as priests. And less than half of Americans and Catholics (42%; 37%) support allowing gay marriage in the Catholic Church
- Catholic women are more likely than Catholic men to support the church permitting gay marriage (46% vs. 29%) as well as divorce (66% vs. 50%)
- Views on certain Catholic rules have changed since we last asked in 2013: The share of Americans who say the Catholic Church should allow abortion in some cases has increased 7 points, while the share who say priests should be allowed to marry has declined by 9 points
— Carl Bialik contributed to this article
Throughout this report, some numbers may appear to be off by 1 because of rounding
See the toplines and crosstabs for the April 25 - 28, 2025 Economist/YouGov Poll
Methodology: The poll was conducted among 1,785 U.S. adult citizens. Respondents were selected from YouGov’s opt-in panel to be representative of U.S. adult citizens. A random sample (stratified by gender, age, race, education, geographic region, and voter registration) was selected from the 2019 American Community Survey. The sample was weighted according to gender, age, race, education, 2024 presidential vote, 2020 election turnout and presidential vote, baseline party identification, and current voter registration status. 2024 presidential vote, at time of weighting, was estimated to be 48% Harris and 50% Trump. Demographic weighting targets come from the 2019 American Community Survey. Baseline party identification is the respondent’s most recent answer given around November 8, 2024, and is weighted to the estimated distribution at that time (31% Democratic, 32% Republican). The margin of error for the overall sample is approximately 3%.
Image: Getty
What do you really think about President Trump, American politics in general, and everything else? Share your reality, join the YouGov panel, and get paid to share your thoughts. Sign up here.


