• The most popular news websites in AmericaRatings

    The most popular news websites in America

    Explore popularity data with YouGov Ratings.

  • The most popular news & politics magazines in AmericaRatings

    The most popular news & politics magazines in America

    Explore popularity data with YouGov Ratings.

  • The most popular communications & media brands in AmericaRatings

    The most popular communications & media brands in America

    Explore popularity data with YouGov Ratings.

  • Economist Toplines May 12 2014Survey Results

    Economist Toplines May 12 2014

    The Economist /YouGov Poll Sample 1000 General Population Respondents Conducted May 10-12, 2014 Margin of Error 4.3% 1. Some people...

    2014-05-13
  • Economist Toplines June 9 2014Survey Results

    Economist Toplines June 9 2014

    The Economist /YouGov Poll Sample 1000 General Population Respondents Conducted June 7-9, 2014 Margin of Error 4.1% 1. Some people seem...

    2014-06-10
  • Poll Results: Paul RyanArticle

    Poll Results: Paul Ryan

    These are the topline results of a YouGov/Economist survey of 1000 US adults interviewed May 3-5, 2014 on Paul Ryan. The results show that he is seen as the most qualified candidate for President among Republicans. The margin of error is 4.2%. Click here to see full tables and demographic crossbreaks ...

    2014-05-09
  • Poll Results: Chris ChristieArticle

    Poll Results: Chris Christie

    These are the topline results of a YouGov/Economist survey of 1000 US adults interviewed March 29-31, 2014 on Chris Christie. The results show that Americans tend to have unfavorable, rather than favorable, opinions of the New Jersey governor.The margin of error is 4.1%. Click here to see full tables and demographic ...

    2014-04-07
  • Poll Results: Rand PaulArticle

    Poll Results: Rand Paul

    These are the topline results of a YouGov/Economist survey of 1000 US adults interviewed April 5-7, 2014 on Rand Paul. The results show that tend to have a positive impression of Rand Paul.The margin of error is 4.2%. Click here to see full tables and demographic crossbreaks Do you have a ...

    2014-04-10
  • Poll Results: Jeb BushArticle

    Poll Results: Jeb Bush

    These are the topline results of a YouGov/Economist survey of 1000 US adults interviewed March 1-April 5, 2014 on healthcare reform. The results show that Americans are still highly divided over by Obamacare.The margin of error is 4.1%. Click here to see full tables and demographic crossbreaks Do you have a ...

    2014-04-21
  • Poll Results: Marco RubioArticle

    Poll Results: Marco Rubio

    These are the topline results of a YouGov/Economist survey of 1000 US adults interviewed April 26-28, 2014 on Marco Rubio. The results show that opinion on Marco Rubio is split, but many Americans don't really know who he is. The margin of error is 4.3%. Click here to see full tables ...

    2014-05-05
  • Poll Results: HuckabeeArticle

    Poll Results: Huckabee

    These are the topline results of a YouGov/Economist survey of 1000 US adults interviewed April 19-21, 2014 on Mike Huckabee. The results show that opinion of Huckabee is nearly evenly divided. The margin of error is 4.1%. Click here to see full tables and demographic crossbreaks Do you have a favorable ...

    2014-04-29
  • Poll Results: Elizabeth WarrenArticle

    Poll Results: Elizabeth Warren

    These are the topline results of a YouGov/Economist survey of 1000 US adults interviewed May 10-12, 2014 on Elizabeth Warren. The results show that Elizabeth Warren is widely unknown, though she is popular among Democrats. The margin of error is 4.3%. Click here to see full tables and demographic crossbreaks Do ...

    2014-05-19
  • Poll Results: Ted CruzArticle

    Poll Results: Ted Cruz

    These are the topline results of a YouGov/Economist survey of 1000 US adults interviewed May 17-19, 2014 on Ted Cruz. The results show that Ted Cruz faces stiff competition for any potential 2016 run. The margin of error is 3.9%. Click here to see full tables and demographic crossbreaks Do you ...

    2014-05-23
  • Poll Results: Hillary ClintonArticle

    Poll Results: Hillary Clinton

    These are the topline results of a YouGov/Economist survey of 1000 US adults interviewed February 22-24, 2014 on Hillary Clinton. The results show that nearly half of Americans think that she has the qualifications to be President.The margin of error is 4.1%. Click here to see full tables and demographic crossbreaks ...

    2014-02-27
  • Economist Toplines April 28 2014Survey Results

    Economist Toplines April 28 2014

    The Economist /YouGov Poll Sample 1000 General Population Respondents Conducted April 26-28, 2014 Margin of Error 4.3% 1. Some people...

    2014-04-29
  • Economist Toplines March 3 2014Survey Results

    Economist Toplines March 3 2014

    The Economist /YouGov Poll Sample 1000 General Population Respondents Conducted March 1-3, 2014 Margin of Error 3:9% 1. Some people...

    2014-03-04
  • Poll Results: Joe BidenArticle

    Poll Results: Joe Biden

    These are the topline results of a YouGov/Economist survey of 1000 US adults interviewed March 1 - 3, 2014 on Joe Biden. The results show that nearly half of Americans would be uneasy with Joe Biden handling an international crisis. The margin of error is 3.9%. Click here to see full ...

    2014-03-07
  • Economist Toplines July 28 2014Survey Results

    Economist Toplines July 28 2014

    The Economist /YouGov Poll Sample 1000 General Population Respondents Conducted July 26-28, 2014 Margin of Error 5% 1. Some people seem...

    2014-07-29
  • Economist Toplines May 19 2014Survey Results

    Economist Toplines May 19 2014

    The Economist /YouGov Poll Sample 1000 General Population Respondents Conducted May 17-19, 2014 Margin of Error 3.9% 1. Some people...

    2014-05-19
  • Economist Toplines April 21 2014Survey Results

    Economist Toplines April 21 2014

    The Economist /YouGov Poll Sample 1000 General Population Respondents Conducted April 19-21, 2014 Margin of Error 4.1% 1. Some people...

    2014-04-24
  • Economist Toplines April 7 2014Survey Results

    Economist Toplines April 7 2014

    The Economist /YouGov Poll Sample 1000 General Population Respondents Conducted April 5-7, 2014 Margin of Error 4.2% 1. Some people...

    2014-04-11
  • Economist Toplines March 31 2014Survey Results

    Economist Toplines March 31 2014

    The Economist /YouGov Poll Sample 1000 General Population Respondents Conducted March 29-31, 2014 Margin of Error 4:1% 1. Some people...

    2014-04-01
  • Economist Toplines February 24 2014Survey Results

    Economist Toplines February 24 2014

    The Economist /YouGov Poll Sample 1000 General Population Respondents Conducted February 22-24, 2014 Margin of Error 4:1% 1. Some...

    2014-02-25

How Americans rate Donald Trump's handling of 52 issues

Taylor OrthDirector of Survey Data Journalism
May 08, 2025, 9:12 PM GMT+0

Americans are more likely to disapprove than approve of Donald Trump's handling of dozens of issues, a new survey finds. The survey measured opinions on 52 issues (each respondent was asked about a random sample of 26), and found that for 48 of the issues, Trump's net approval — meaning the share who strongly or somewhat approve of how he is handling the issue minus the share who disapprove — was negative.

Among the 52 issues on the survey, Trump performs worst on inflation/prices (-26 net approval), changes to geographic names (-21), federal workforce reductions (-17), relations with Canada (-16), presidential pardons (-16), and tariffs and trade (-15).

The only issues for which more Americans approve than disapprove of Trump's handling are crime (+9 net approval), border security (+4), national security (+1), and immigration (+1).

Net approval of Trump's handling of the presidency overall — without specifying an issue — is -10 on this survey, and has declined since the start of his term. His average net approval across the 52 issues in this survey is -9, similar to his overall net approval.

40 of the issues included in this week's survey were asked about on a survey conducted in early March, roughly seven weeks earlier. On this subset of issues, Trump's average net approval fell to -9 from -5 during this period. In the most recent survey, approval of his handling of the 40 issues ranged from -21 to +4; in March, it ranged from -20 to +19.

The largest shifts in opinion have been on issues Trump generally scores highest on — and had more room to fall. The average drop in net approval of the 20 issues he rated highest on in March was 7 points, compared to a drop of 2 points for the bottom 20 issues. Net approval declined most for the two issues for which he had the highest ratings in March: border security (to +4 from +19 in March) and deportation (to -2 from +15).

Other issues with a significant decline in net approval of Trump's handling during this period include transgender issues, use of executive orders, corruption, consumer protection, and federal workforce reductions.

There was only a significant (though small) increase in net approval of Trump's handling of two issues during this period: health care costs (to -8 from -14 in March) and cryptocurrency (to -7 from -12).

The survey also asked Americans how important each of the 52 issues are to them. Overall, there is not a strong correlation between an issue's perceived importance and net approval of Trump's handling of it. However, inflation/prices stands out on both measures: It is the issue Americans are most likely to say is very important to them, and also the one with Trump's lowest net approval.

There are strong correlations — in opposite directions — between the issues that Democrats and Republicans deem very important, and those for which they approve of Trump's handling. Many of the issues that Democrats care most about — such as health care costs and democracy — are those that they think Trump is doing worst on.

Among Republicans, net approval of Trump is generally highest for the issues they care most about, and lowest for those they care least about. Inflation/prices is one exception: It ranks third among issues Republicans say are very important but is in the bottom five in their net approval of Trump's handling.

Democrats are more likely than Republicans to rate most issues as very important to them. Far more Democrats than Republicans say climate change and the environment, diversity, equity, and inclusion, women's rights, environmental regulations, and civil rights are very important. Republicans are far more likely than Democrats to say border security is a very important issue to them, and somewhat more likely to say immigration, national debt, and government spending are.

— Carl Bialik contributed to this article

See the results for this YouGov poll

Methodology: The poll was conducted online among 2,220 U.S. adult citizens on two separate surveys from April 25 - 29, 2025 and April 28 - May 2, 2025. A random sample (stratified by gender, age, race, education, geographic region, and voter registration) was selected from the 2019 American Community Survey. The sample was weighted according to gender, age, race, education, 2024 presidential vote, 2020 election turnout and presidential vote, baseline party identification, and current voter registration status. 2024 presidential vote, at time of weighting, was estimated to be 48% Harris and 50% Trump. Demographic weighting targets come from the 2019 American Community Survey. Baseline party identification is the respondent’s most recent answer given around November 8, 2024, and is weighted to the estimated distribution at that time (31% Democratic, 32% Republican). The margin of error for the overall sample is approximately 3%.

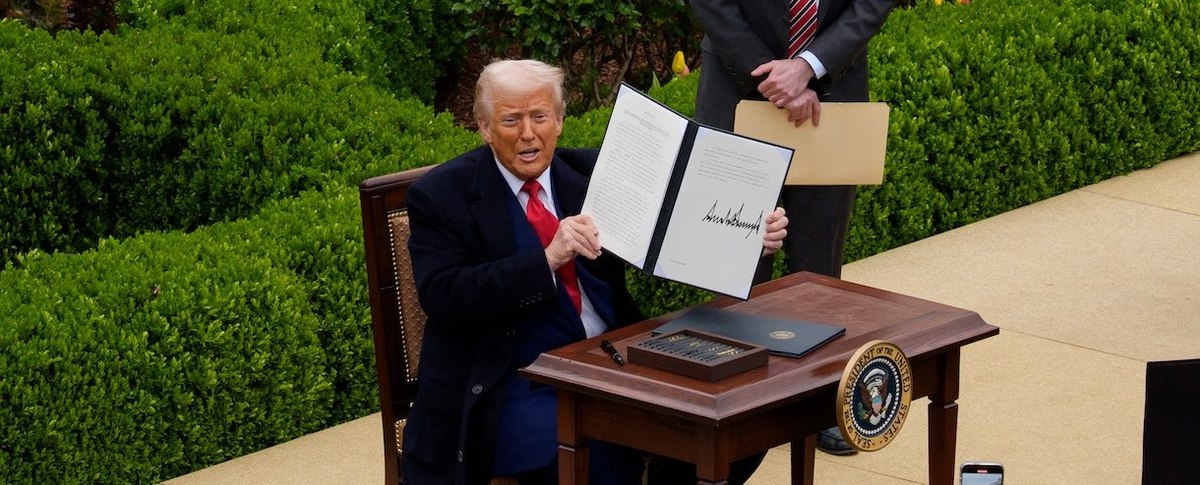
Image: Getty

What do you really think about President Trump, American politics in general, and everything else? Share your reality, join the YouGov panel, and get paid to share your thoughts. Sign up here.