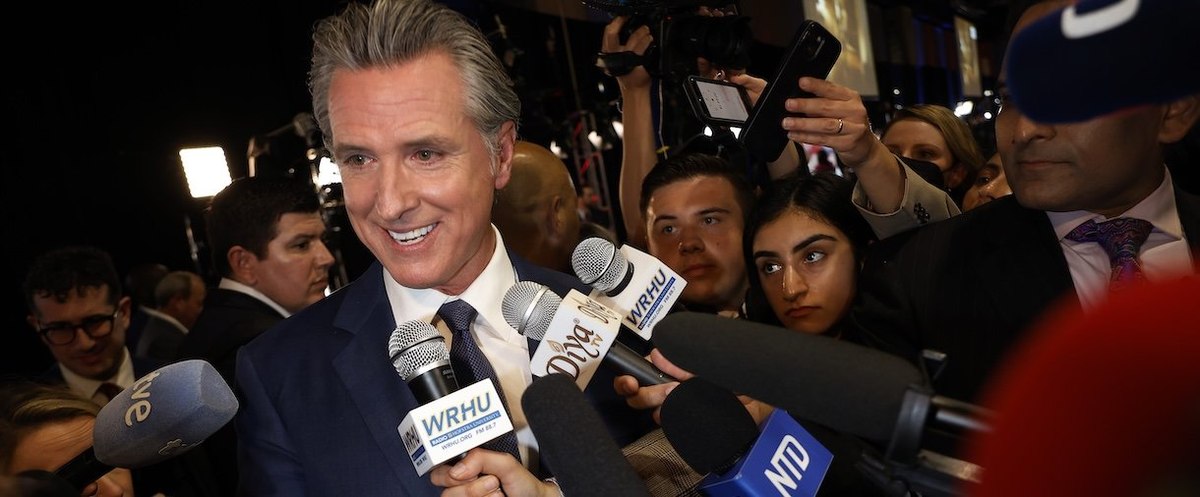
A recent YouGov survey asked Democrats, Republicans, and Independents who lean towards either party about potential 2028 presidential candidates. The lists of potential nominees for each party that the survey asked about are based on previous polls asking members of each party who they were most likely to say they'd consider, as well as on recent open-ended questions asking who they would most like to see nominated.
Democratic candidates
Gavin Newsom and Kamala Harris are the politicians among a list of 12 in the poll whom Democrats and Democratic-leaning Independents are by far most likely to say they'd consider voting for in a 2028 Democratic presidential primary: 55% say they'd consider Newsom, and 54% Harris.
Newsom and Harris are followed by Pete Buttigieg (41%), Tim Walz (40%), Alexandria Ocasio-Cortez (38%), and Bernie Sanders (36%). Less than one-third say they'd consider each of Elizabeth Warren (29%), Cory Booker (28%), JB Pritzker (24%), Gretchen Whitmer (20%), Mark Kelly (18%), and Amy Klobuchar (18%). Zohran Mamdani and Jasmine Crockett are the most popular write-in choices who didn't make the list of 12. Respondents were asked to select all candidates they'd consider.
Newsom is also the person named by the greatest share of Democrats as their ideal 2028 nominee: 23% choose Newsom, followed by 19% for Harris, 8% for Ocasio-Cortez, 6% for Buttigieg, 5% for Walz, and 5% for Sanders. Each of the five other options are the top choice of less than 5% of Democrats.
Newsom's standing has risen significantly since similar questions were asked on the Economist/YouGov Poll in April. The share of Democrats and Democratic-leaning Independents who say they would consider voting for him as the Democratic nominee in 2028 has risen 24 percentage points, to 55% from 31%. The share who say Newsom is their ideal candidate has increased 16 points, to 23% from 7%.
The share who would consider voting for Harris as the Democratic nominee has changed little since April, but the share who say she is their ideal nominee has fallen to 19% from 25%. The shares saying they would consider voting for Whitmer and Kelly each have declined by 7 points since April.
Democrats and Democratic-leaning Independents are most likely to say they'd be disappointed to have Harris (19%), Sanders (18%), or Booker (17%) as the 2028 nominee. The shares saying they'd be disappointed by Booker, Buttigieg, Whitmer, or Kelly becoming the Democratic nominee have increased since April, while the share who'd be disappointed by Newsom as nominee has declined.
Republican candidates
Among Republicans and Republican-leaning Independents, by far the largest share say JD Vance (65%) is someone they would consider voting for in the 2028 Republican presidential primary, from a list of 11 options in the poll that did not include President Trump; respondents could select all whom they would consider.
Vance is followed by Ron DeSantis (40%), Donald Trump, Jr. (37%), Marco Rubio (33%), and Ted Cruz (29%). Less than one-quarter said they'd consider each of Vivek Ramaswamy (23%), Tulsi Gabbard (20%), Robert F. Kennedy, Jr. (18%), Mike Pence (15%), Nikki Haley (14%), and Tim Scott (13%).
Vance is the top choice of 44% of Republicans; 10% choose Trump, Jr. and 8% choose DeSantis. Far fewer Republicans (4% or less) name each of the other options as their ideal candidate.
Republicans' and Republican-leaning Independents' views on who they would consider voting for as the 2028 Republican nominee have changed little since April. Slightly less say they'd consider voting for Scott or Kennedy than did in April.
Since April there has been an increase in the shares of Republicans and Republican-leaning Independents who would be disappointed in Kennedy, Ramaswamy, Cruz, Trump Jr., andor Scott becoming the Republican presidential nominee.
While Trump has floated the idea of trying to be president for a third term, we limited our list of potential candidates to those who are currently eligible to run. However, we did ask a follow-up question of Republicans and Republican-leaning Independents who selected an ideal candidate from the list provided, to find out if they would prefer Trump over their top choice from the list.
Somewhat more say they'd rather have their top pick from the list without Trump than say they'd prefer Trump (59% vs. 39%). Republicans who identify as MAGA Republicans are evenly split (50% prefer their top non-Donald Trump choice and 49% prefer Trump); most Republicans who say they aren't MAGA prefer their non-Trump top pick rather than Trump (73% vs. 27%).
Nearly half (46%) of Americans expect that Trump will attempt to serve a third term as president, while 37% think he will not. Democrats are more than twice as likely as Republicans to think he will attempt to do so (67% vs. 27%).
Only 13% of Americans think that Trump should attempt to serve a third term; 78% think he should not. Among Republicans, 30% think he should do so, while 58% say he should not.
— Carl Bialik contributed to this article
See the results for this YouGov poll
Methodology: This article includes results from an online survey conducted September 5 - 8, 2025 among 1,114 U.S. adult citizens. Respondents were selected from YouGov’s opt-in panel to be representative of adult U.S. citizens. The sample was weighted according to gender, age, race, education, 2024 presidential vote, 2020 election turnout and presidential vote, baseline party identification, and current voter registration status. 2024 presidential vote, at time of weighting, was estimated to be 48% Harris and 50% Trump. Demographic weighting targets come from the 2019 American Community Survey. Baseline party identification is the respondent’s most recent answer given around November 8, 2024, and is weighted to the estimated distribution at that time (31% Democratic, 32% Republican). The margin of error for the overall sample is approximately 4%.
Image: Getty
What do you really think about President Trump, American politics in general, and everything else? Share your reality, join the YouGov panel, and get paid to share your thoughts. Sign up here.


