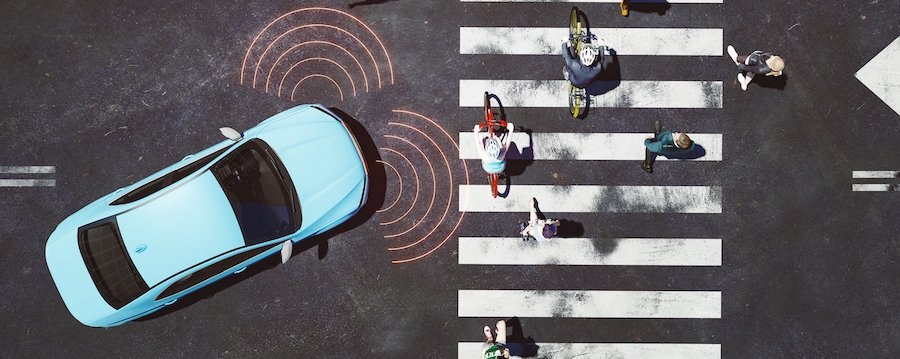
Americans are widely skeptical about the prospect of driverless cars, with majorities saying they’re worried about the new technology and potential dangers it could pose, according to recent polling by the Economist/YouGov.
For example, majorities of Americans say they’re very or somewhat worried about driverless cars (76%), that they would feel very or somewhat unsafe as a passenger in a driverless car (68%), and that they strongly or somewhat oppose allowing self-driving taxis to operate in their town (56%). Majorities also strongly or somewhat support government regulation forcing driverless cars to pass special safety tests (85%), to be specially marked (83%), and to have a human backup driver (79%).
Driverless taxi companies are currently operating in several U.S. cities, including San Francisco and Phoenix. They’ve proven divisive: The companies say their driverless vehicles will revolutionize transportation and are already safer than human drivers, while critics say the cars get in the way of emergency vehicles and are prone to mishaps.
So far, most Americans are siding with the critics. Twice as many U.S. adult citizens believe widespread use of driverless cars will increase the number of people killed or injured in traffic crashes (38%) than believe that driverless cars will decrease traffic casualties (17%), with 15% expecting no change and 28% unsure.
Levels of worry about driverless cars are higher among Americans without college degrees, and especially among older Americans. Among Americans 65 and older, 45% say they’re “very worried” about the use of driverless cars, compared to 19% of 18- to 29-year-olds. Among Americans 65 and older without a college degree, 51% are “very worried.”
Majorities in every age group say they’re at least somewhat worried about driverless cars.
See the toplines and crosstabs from the Economist/YouGov poll conducted on September 10 - 12, 2023 among 1,500 U.S. adult citizens.
Methodology: Respondents were selected from YouGov’s opt-in panel using sample matching. A random sample (stratified by gender, age, race, education, geographic region, and voter registration) was selected from the 2019 American Community Survey. The sample was weighted according to gender, age, race, education, 2020 election turnout and presidential vote, baseline party identification, and current voter registration status. Demographic weighting targets come from the 2019 American Community Survey. Baseline party identification is the respondent’s most recent answer given prior to November 1, 2022, and is weighted to the estimated distribution at that time (33% Democratic, 31% Republican). The margin of error for the overall sample is approximately 3%.
Image: Getty (gremlin)


