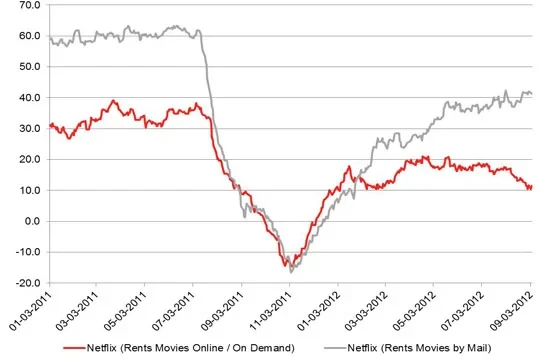
More than a year after its pricing debacle, Netflix’s US perception has seen a strong rebound with people who rent movies through the mail, but remains at depressed levels with online or streaming movie renters.
Netflix has become a tale of two types of customers, and whether it will be able to please both equally well. There are the movies-through-the-mail renters who have led Netflix’s consumer perception rebound, although even their scores still have not recovered to pre-crisis levels. Then there are the on-demand/streaming customers, whose perception rebound has been sputtering since early July, possibly due to an expanding and very competitive set of movie streaming and downloading options available to consumers.
Netflix has nearly always had much better perception with DVD mail subscribers who are usually 25 to 30 points ahead of streaming fans.
Netflix took a steep overall four-month perception drop from mid-July 2011, when the new pricing scheme was announced. While the group of mail DVD renters continued a steady path back to perception recovery, the on-demand/streaming group stalled near the end of January 2012, and hasn’t moved much since then.
Netflix was measured with YouGov BrandIndex’s Buzz score, Buzz score, which asks “If you've heard anything about the brand in the last two weeks, through advertising, news or word of mouth, was it positive or negative?” Results were filtered into two groups of consumers: 1) adults 18+ who rent movies through mail subscriptions, and 2) adults 18+ who rent movies through on-demand, streaming or pay-per-view.
The consumer perception bottom for Netflix was November 15, 2011, when mail subscribers had a -11 buzz score and streaming subscribers had -13.
Mail subscribers have bounced back a fair amount since then, with a current buzz score of 42 compared to its pre-crisis scores in the low 50s. On the other hand, Buzz among streaming consumers reached a 14 score on February 3rd, hovered around 17-18 through mid-July, and has been slowly tapering off since then. This group’s current score is 12, representing a 30-point difference between the two consumer demos.


