
The Golden Globes kicked off the 2021 awards season by announcing its nominations last week. Most shows have pushed back their ceremonies – likely in hopes of in-person events being able to return – and the awards season has been effectively spread out over half a year.
Live viewership of awards shows has shown declines for decades, especially among US adults aged 18-49 but YouGov data shows these awards have a certain relevance for many people even if they choose not to watch. To explore how awards shows, media and brands can tap into their relevant audiences, we looked at who is interested in the most-watched awards shows: Golden Globe Awards, Academy Awards, Grammy Awards, and Emmy Awards.
People are three times as likely to express interest in awards shows than the number that actually watch them live. That’s a big opportunity for advertisers to reimagine the experience, extending reach and relevance.
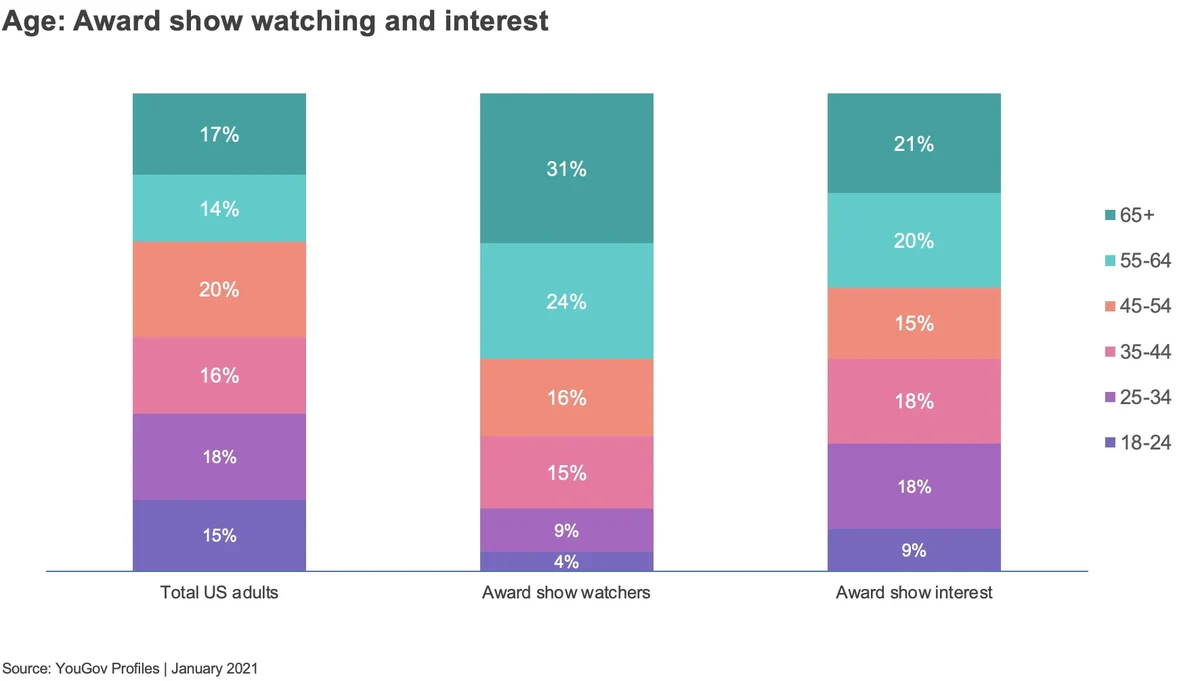
Awards show-watchers are much older than the general population: over half are 55 or older. However, the appeal of awards shows is broader than just those who watch the events themselves. People interested in awards shows have an age spread closer to total adults (although they’re still slightly older). By reframing the award show experience beyond the event itself, there is opportunity to engage with a younger audience.
There is also an opportunity to be more gender-balanced when connecting with people interested in awards shows, compared to targeting watchers of the show itself. Awards show-watchers skew just under two-thirds female, but the female skew is milder among adults who are interested in award shows.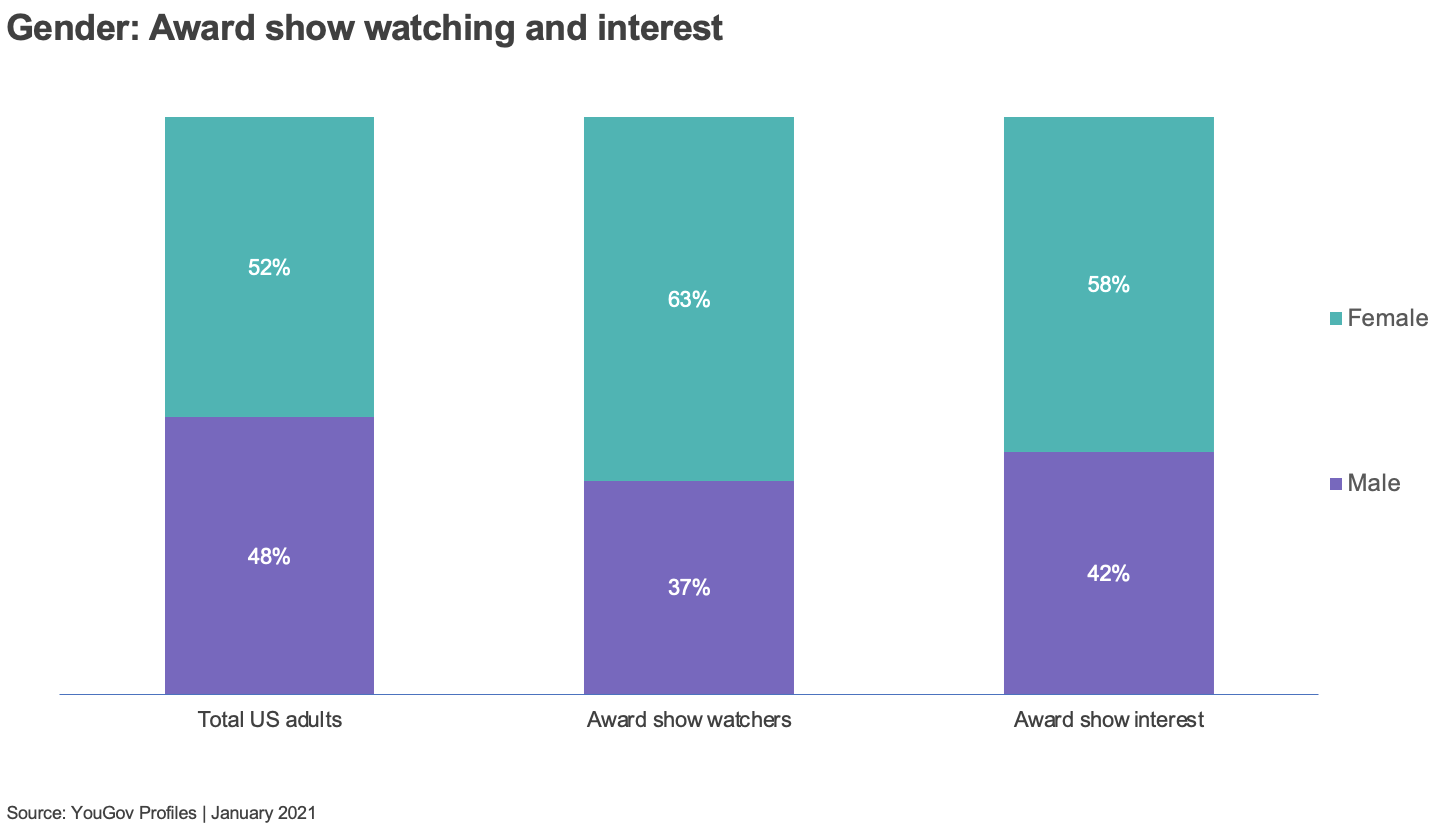
As awards shows and the wider entertainment industry work to increase diverse representation, our data suggests that there is legitimate optimism that these initiatives can also engage diverse audience. Awards show-watchers skew slightly more White than total US adults, which is expected given their older age. However, people interested in award shows are just as diverse – arguably slightly more diverse -- than the racial makeup of the US population.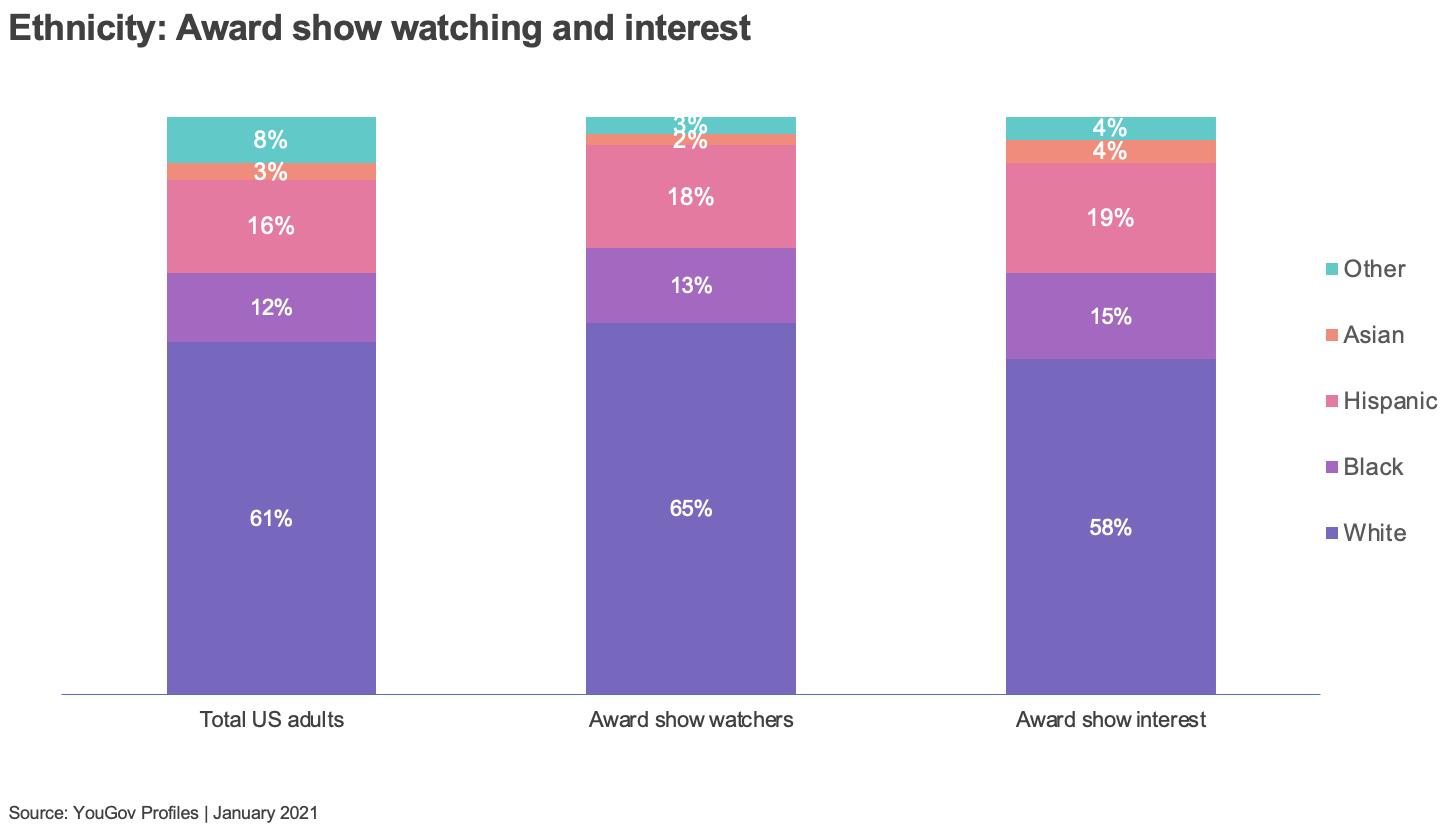
Data suggests that the appeal of awards shows is greatest among an audience possessing a general appreciation for creativity and self-expression. Awards show-watchers and those interested in awards shows are almost twice as interested in People & Celebrities versus the general population, and they are also more interested in topics such as Music, Beauty, Fashion & Design, and Interior Design. Their predisposition to these topics is likely what leads them to be interested in - and watchers of - awards shows in the first place.
Looking at media consumption, audio and social channels could be important in extending the impact of awards shows beyond the typical broadcast and live stream of the event itself. We see that people are not going to be an awards show-watcher unless they tend to also watch live TV - 98% of this group say they watch live TV during a typical week. However, people who are interested in award shows overindex in their usage of audio channels (radio and streaming) and some social media.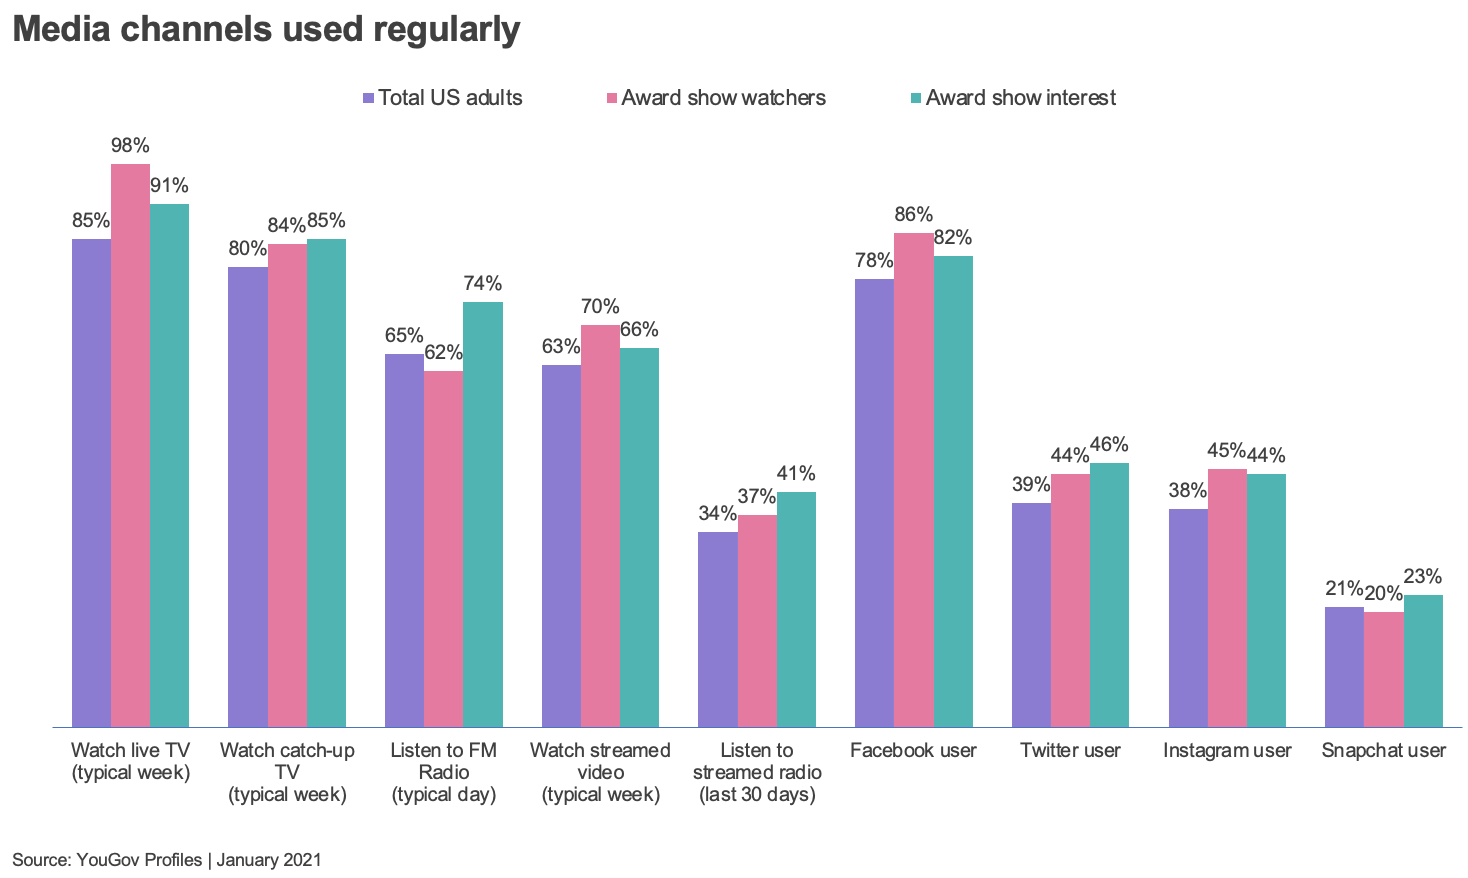
The challenge for industry organizations and networks looks to be in transforming the experience of awards shows – beyond the traditional format and distribution strategy – by finding new ways to engage a broader audience. Are there ways that people interested in TV, film, and music could become a part of the nomination or voting process? How can fans be incorporated into the live event? Does there even need to be a live event? Radical changes might need to be on the table — at least for consideration — to grow the full potential of awards shows’ reach and relevance.
For free insights into how media landscapes across the world have changed, download YouGov’s new International Media Consumption 2021 Report
Methodology: The data is based on the interviews of US adults aged 18 and over. All interviews were conducted online, and results have been weighted to be nationally representative. Figures are based on a 52-week rolling average preceding January 24, 2021.