
This note provides detailed information about the performance of YouGov's House polls. An analysis of YouGov's Senate polls can be found here.
In the 2014 midterm elections, YouGov polled all 435 congressional districts for the CBS News/New York Times Battleground Trackers. CBS and the New York Times identified 44 congressional districts as being “most competitive” and we recruited additional panelists in these districts. Over four waves, starting on July 5 and ending on October 23, we interviewed a total of 194,264 respondents. The number of interviews per district ranged from 78 to 1751, with larger numbers of respondents in the most competitive districts.
This was a true panel. 41,239 respondents answered all four waves. An additional 33,596 respondents participated in three waves and 34,863 in two waves. Because we have multiple interviews with most respondents, we are able to measure the amount of change in vote intentions over the course of the campaign. Lynn Vavreck’s analysis of undecided voters is an example of what can be done with this design.
In this note, we review the accuracy of the district-level estimates of vote share from the last wave of the Battleground Tracker. The estimates were released on the CBS website on October 31. Further details may be found here.
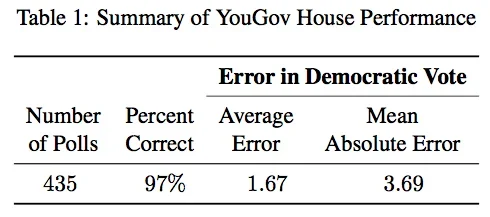
In 97% of the races, the leader in the poll was also the election winner. The leading candidate only lost in 13 of 435 seats. 11 of the 13 miscalled races were won by a Republican and two by a Democrat. In 339 of the 354 contested races (96%,) the poll estimate was within the margin of error. Theoretically, 95% of the estimates are expected to be within the margin of error of the final outcome, so this is the appropriate level of error. (If the error rate were either lower or higher, then this would be a sign that the margins of error were not correctly calculated.)
The average absolute error was 3.69%, which is satisfactory given the sample sizes are small. The average error (or “bias”) was 1.67%, indicating that, on average, we over-estimated Democratic vote by a bit less than two points. We have a similar Democratic bias in our Senate estimates and most other polls suffered from similar problems. In past elections, we have been able to obtain an average error less than 1% in magnitude, so this represents an area for further investigation and potential improvement.
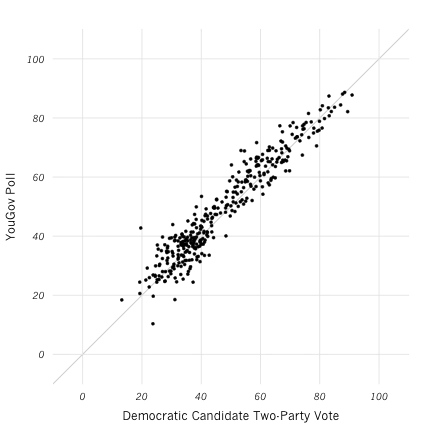
Because the samples in most districts are small, most of the estimates have a large margin of error. In the scatterplot below, we show that the vote estimates from the survey are closely correlated with the vote tally (from 1:45 a.m. EST yesterday). Each point in the graph represents a district with horizontal coordinate equal to the Democratic vote share in the district and vertical coordinate equal to the poll estimate. Points above the 45° line are over-estimates of the Democratic vote and points below are under-estimates. Overall, the points are closely clustered along the 45° line.
Figure 1: Comparison of House Polls and Votes
Finally, aggregating our estimates across districts, we predicted that Republicans would end up with 239 seats. The actual outcome appears to be that Republicans will win 244 seats. The slight underestimate is due to aforementioned overestimate of the Democratic vote across the sample, though the difference is well within the margin of error. (In fact, based on our data, CBS projected a six to twelve seat gain for Republicans and the actual outcome was within this interval.)
Updated on November 18, 2014.
PA image