
Latest results from the CBS News-YouGov House Model
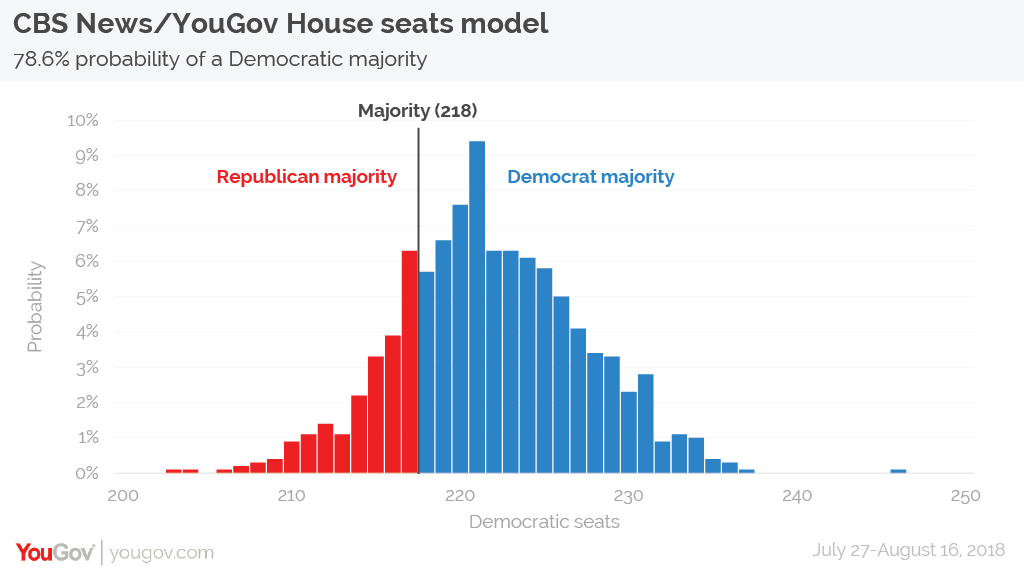
The latest CBS News-YouGov House Model estimates a Democratic majority in the House of Representatives, with the party on 222 seats to the Republicans' 213. With a margin of error of 11 seats, however, this means that control of the House is within reach of either party.
In terms of the national vote, the Democrats are currently estimated to win 51.5% of ballots cast compared to 44.7% for the Republicans and 3.8% for other parties and candidates.
 Click to enlarge
The Democrats currently hold 195 seats in the House, so even pessimistic scenarios see them making gains. In the "Democrat Low" scenario the party sees an increase of 16 seats to 211, although this still leaves them 7 seats short of a majority. In the more optimistic "Democrat High" scenario the Democrats win 233 seats overall.
Explore the Battlegrounds data
The CBS News 2018 Battleground Tracker is a more narrow look at data from 64 competitive and likely competitive congressional districts within the larger model. You can explore and combine voting intention, economic satisfaction and political interest data, among other factors, in the Crunchbox below. You can also find the data here.
CBS News-YouGov House Model methodology
The CBS News-YouGov House Model is based on interviews with 62,372 registered voters from July 27 – August 16, 2018, including respondents from the CBS News Battleground Tracker as well as other YouGov surveys. While this is a large sample, we nonetheless use the model to produce more reliable estimates for the districts than would be achievable based on the amount of sample in each of them alone, and the model accounts for the uncertainty around each of those estimates. The House estimate's margin of error corresponds to a 95% confidence interval.
We use a technique called Multilevel Regression and Post-stratification (or MRP for short) to produce estimates for all 435 Congressional districts. The idea behind MRP is to use the polling data from the preceding seven days to estimate a model relating interview date, district, voter demographics, past voting behavior, and other respondent profile variables to their current voting intentions. This model is then used to estimate the probability that a voter with specified characteristics prefers the Democratic or Republican House candidate. Using data from the American Community Survey, the Current Population Survey, both produced by the US Census, and past election results, we estimated the number of each type of voter in each district. We also estimated a turnout model using data on past midterm elections. The product of estimated party preference rates, turnout rates, and census counts provides an estimate of the number of voters in each district intending to vote for a party on each day.
The models were simulated repeatedly to obtain a range of estimates and corresponding confidence intervals for each of the 435 seats and the total number of seats won by each party. The full results of the simulations can be seen below.


