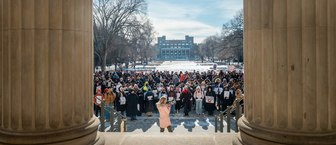
A new YouGov survey on protesting finds that large majorities of Americans find it acceptable to protest through methods such as writing letters, signing petitions, and calling representatives. These are also among the forms of protest Americans are most likely to have participated in themselves, out of 24 asked about in the poll. Democrats are more likely than Republicans to find many acts of protest acceptable, and they are also more likely to have engaged in many of these acts themselves.
Around nine in 10 Americans find each of the following forms of protest to be always or usually acceptable: writing a letter to an elected official (91%), signing a petition (90%), participating in a community meeting or town hall (90%), handing out flyers (89%), and calling your representative (89%).
The forms of protest that the largest shares of Americans find unacceptable are defacing property (89%), rioting (86%), and blocking traffic (82%).
Democrats are more likely than Republicans to say many of the forms of protest asked about are acceptable. Among the largest differences: 42% of Democrats and 5% of Republicans say burning an American flag is an acceptable form of protest. 83% of Democrats and 53% say performing protest music publicly is an acceptable form of protest; 37% of Democrats and 7% of Republicans say the same about establishing encampments.
Democrats are more likely now than they were in September 2023 to say sit-ins are an acceptable way to protest (85% vs. 66%). They are also more likely now than they were in 2023 to say burning the American flag is an acceptable form of protest (42% vs. 26%).
Republicans are less likely now than they were in September 2023 to say chanting or singing is an acceptable form or protest (71% vs. 84%). They are also less likely now than they were in 2023 to say picketing is an acceptable way to protest (63% vs. 73%).
What are the ways Americans have protested? 59% of Americans have participated in at least one of the 24 forms of protest asked about. The most common form of protest Americans have participated in is signing a petition (44%). Many have also protested by boycotting products (30%), writing a letter to an elected official (27%), posting a political message online (26%), or calling their representative (24%).
Three-quarters (76%) of Democrats and 57% of Republicans have participated in at least one of the 24 types of protests asked about. Democrats are more likely than Republicans to say they have donated to activist organizations (35% vs. 7%), attended a march or rally (37% vs. 10%), signed a petition (63% vs. 38%), and held a protest sign (30% vs. 6%).
Americans 65 and older are more likely than younger adults to say they have participated in many forms of protest, including signing a petition (59% vs. 39%), writing a letter to an elected official (45% vs. 22%), and calling their representative (42% vs. 19%). Half (50%) of adults under 30 have not engaged in any of the forms of protest asked about, compared to only 29% of Americans 65 and older. (The younger the adult, the fewer years of adulthood they've had to engage in protest.)
Related:
- Most Americans are OK with protests involving flyers and petitions. Blocking traffic? Not so much
- Half of Americans say it should be illegal to burn the US flag
- More Americans think the U.S. is in a constitutional crisis than think the U.S. is a democracy
See the results for this YouGov survey
— Carl Bialik and Taylor Orth contributed to this article
Methodology: This article includes results from an online survey conducted on October 16 - 20, 2025 among 1,109 U.S. adult citizens. Respondents were selected from YouGov’s opt-in panel to be representative of adult U.S. citizens. The sample was weighted according to gender, age, race, education, 2024 presidential vote, 2020 election turnout and presidential vote, baseline party identification, and current voter registration status. 2024 presidential vote, at time of weighting, was estimated to be 48% Harris and 50% Trump. Demographic weighting targets come from the 2019 American Community Survey. Baseline party identification is the respondent’s most recent answer given around November 8, 2024, and is weighted to the estimated distribution at that time (31% Democratic, 32% Republican). The margin of error for the overall sample is approximately 4%.
Image: Getty
What do you really think about President Trump, American politics in general, and everything else? Share your reality, join the YouGov panel, and get paid to share your thoughts. Sign up here.


