

Democrats were not pleased with President Barack Obama in August 2011. The country was recovering from The Great Recession, and Democrats were battling with Republicans in Congress over the debt ceiling. The fiscal fights arrived amid slides in the economy and fears of another American recession, and the Obama administration watched key polling indicators shift into negative territory as the economy teetered.
Most Americans, including members of Obama's own party, thought the country was on the wrong track (58%) before his re-election.
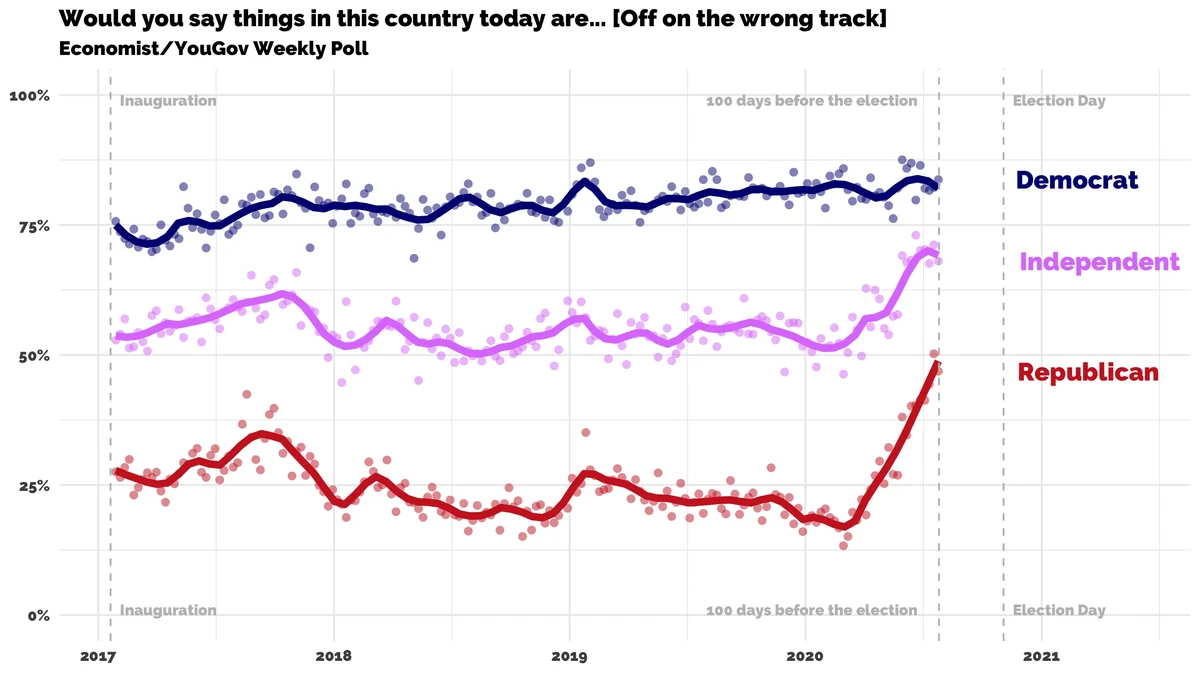
It’s not unlike what President Donald Trump is facing today. Republican belief that the country is “off on the wrong track” has doubled from early January to this week (18% to 39%) as the nation experiences economic turmoil as coronavirus cases continue to rise.
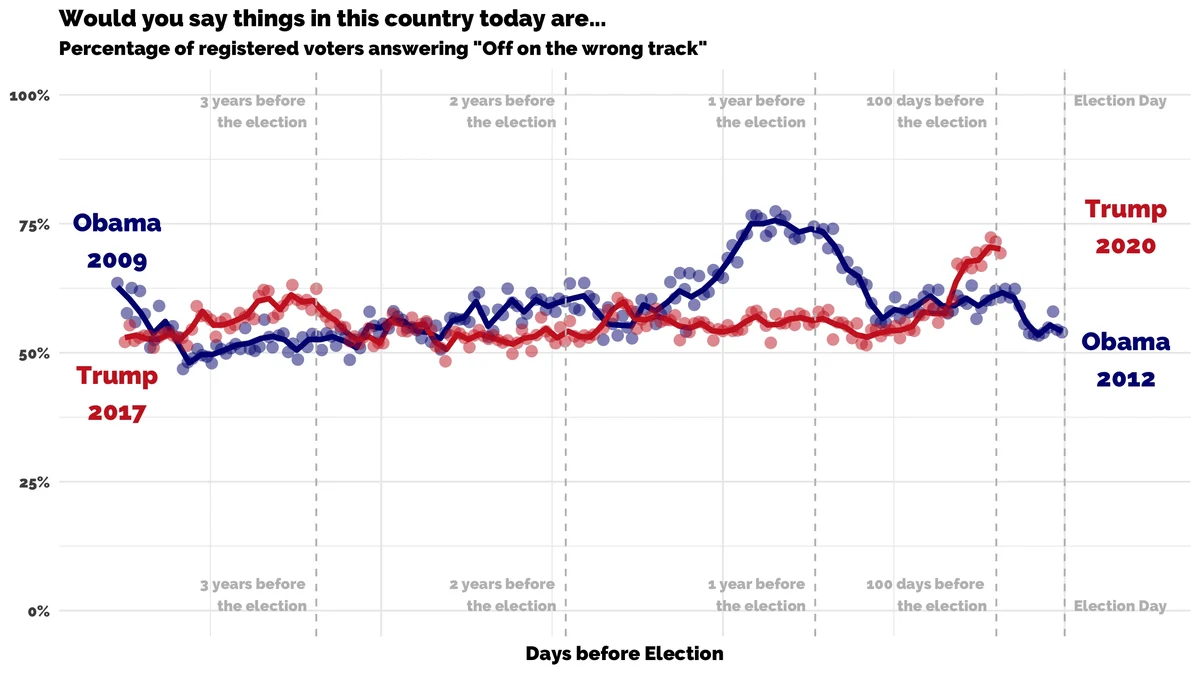
The Economist/YouGov Poll asks Americans each week to share whether they believe things in this country today are “generally headed in the right direction” or “off on the wrong track.” Since YouGov asks this question weekly for each administration, it is possible to compare how Americans felt about the direction of the country from President Obama's inauguration through his re-election in 2012 against the same data from President Trump's inauguration up to present time.
The move into negative wasn't good news for Obama, just like the indicator doesn't seem to be good news for Trump. But there's one key difference — at the height of his party’s disapproval with the direction of the country, Obama wouldn't face reelection for more than a year. Trump faces voters in about 80 days.
Partisanship clearly affects Americans' perceptions of the direction of the country. From President Obama's inauguration in 2009, Democrats consistently held a more optimistic view of the country while Republicans were consistently much more pessimistic. From President Trump's inauguration in 2017, the reverse has been true: Democrats are consistently the most pessimistic, and Republicans are consistently the most optimistic.
While Americans' week-by-week perceptions of the country naturally fluctuate, there has been a steady increase in pessimism among Republicans and Independents. The issue President Trump faces is not increased partisanship, but rather, increased agreement from all Americans that the nation is headed in the wrong direction. The latest Economist/YouGov Poll indicates that two-thirds (66%) of the country now believes the United States is on the wrong track.
It took several months before Obama regained his party’s faith, but by January 2012, the high disapproval leveled off and a plurality of Democrats thought the country was headed in the right direction (48%).
Disapproval about the direction of the country continued to drop rapidly among Democrats as the general election neared. About 100 days out from Obama’s re-election bid against Republican presidential nominee, Mitt Romney, only about one-third of Democrats (35%) believed the country was off on the wrong track.
By mid-September 2012, about one in five Democrats (21%) believed the nation was on the wrong track. The week before the 2012 presidential election, just 16 percent of Democrats — and 53 percent of Americans overall — said the country was on the wrong track.
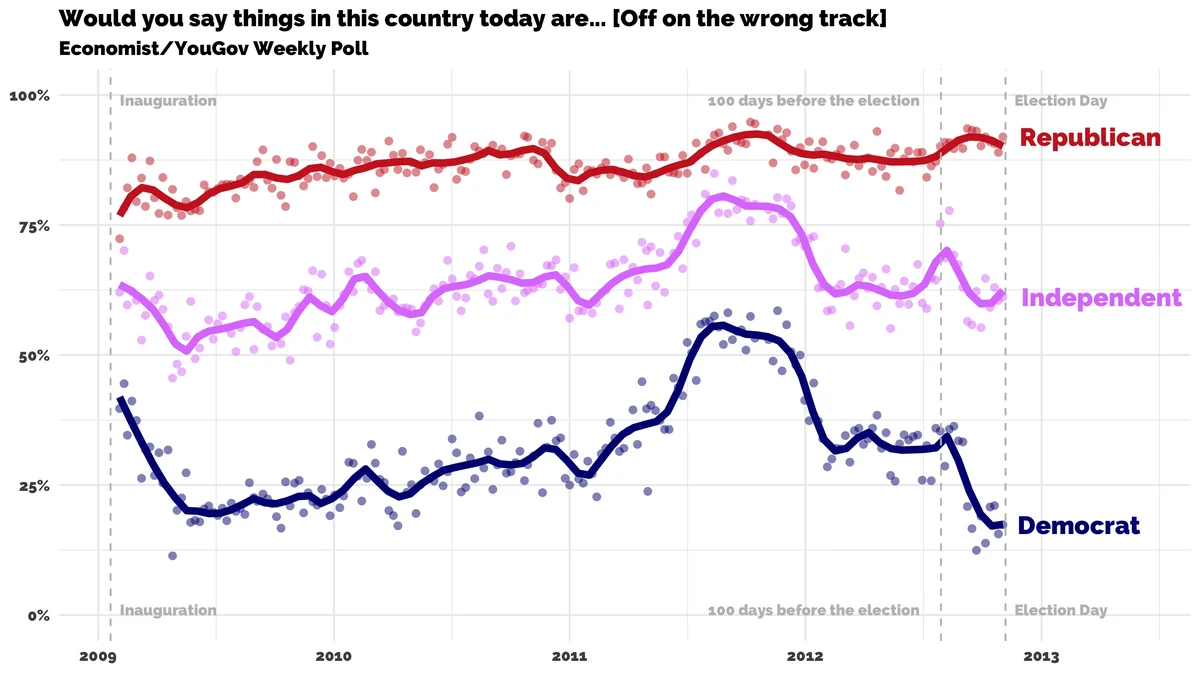
Three-quarters (75%) of Democrats and one-third of Americans overall (36%) believed the country was headed in the right direction just one week prior to the election, and Obama won a second term.
However, disheartening poll numbers for a presidential candidate in late July of an election year do not automatically lead to a loss in November. Looking back to around 100 days before the 2012 election, it appeared President Obama's job approval numbers — which are separate from the questions about the direction of the country — were trending downward.
For example, the week of July 28, 2012, Obama's job approval numbers were only 81 percent among Democrats, 42 percent among registered voters, 32 percent among Independents, and 5 percent among Republicans. In contrast, for the week of July 25, 2020, President Trump's approval numbers were 12 percent among Democrats, 87 percent among Republicans, and 45 percent among Independents.
In comparing Trump's approval numbers to the same time period in Obama's first term, it is clear that President Trump has enjoyed steady approval numbers throughout his time in office while Obama experienced generally declining approval numbers. At 100 days before their respective elections, President Trump earns higher approval numbers than President Obama.
The presidential election is far from a sure thing — and 80 days leaves a lot of room for changes in the race for the White House. Over the last three months of Obama's 2012 campaign, he experienced a surge in co-partisan job approval, climbing up to 85 percent with Democrats, sticking at 5 percent with Republicans and getting up to 42 percent with Independents.
If job approval is all that matters, Trump may very well have just enough to hang onto the White House. If, however, Americans' perception of the direction of the country is the more significant factor, then Trump will need these last 80 days to change a lot of Americans' minds.
See the toplines and crosstabs from this week's Economist/YouGov Poll
Methodology: The data used in this analysis comes from the Economist/YouGov weekly poll results published during President Obama's first term, between January 20, 2009 - November 2, 2012, and President Trump's time in office from January 28, 2017 - July 25, 2020. Respondents were selected from YouGov's opt-in Internet panel using sample matching. A random sample (stratified by gender, age, race, education, and region) was selected from the (2008/2016) American Community Study. Voter registration was imputed from the November (2008/2016) Current Population Survey Registration and Voting Supplement. (Obama/Trump respectively).
There were 89,411 unique individuals included in the data from President Obama and 96,453 unique individuals in the data for President Trump. The increase in unique individuals is the result of expanding weekly survey size from 1000 people per week during President Obama's first term to 1500 people per week during President Trump's term. Weekly samples were weighted on gender, age, race, education, news interest, voter registration. For results published 2009-2012, weekly results include self-reported ideology in weighting variables. For results published 2017-2020, weekly results included 2016 self-reported 2016 presidential vote (or non-vote). The published weekly margins of error range between ±2.5-4.5%
Image: Getty