


Below, we present findings from a series of polls conducted by YouGov shortly before and after the recent 2022 congressional elections asking not about specific candidates, but about voting itself — straight-ticket and split-ticket, term lengths, election integrity, and how America's electoral system compares to others around the world. Democrats and Republicans are far more closely aligned on these issues than on whom they wanted to win in the election — while on some issues, Independents stand apart.
Straight-ticket voting: By 46% to 34%, Americans say they support states offering the option of straight-ticket voting, which enables voters to select one political party's complete slate of candidates for every office by making a single mark on his or her ballot. (Currently, straight-ticket voting is only available in six states.) More Independents oppose than support the option being offered. One in three Americans (32%) say they would vote straight-ticket if given the option, while 46% say they would not. Democrats (48%) are more likely to say they'd vote straight-ticket than Republicans (37%) are, while far fewer Independents (15%) say they would.
Split-ticket voting: Nearly half of Americans (45%) say they've voted split-ticket at some point in their lives, meaning they voted for candidates from more than one political party when multiple offices are being decided in the same election. Independents (44%) are about as likely as Democrats (46%) and Republicans (45%) to say they've voted split-ticket. Split-ticket voting is more common among men (50%) than women (40%).
Uninformed voting: Half of Americans think there's a duty to vote whether or not someone has learned about the candidates on the ballot. Democrats are more likely than Republicans to think so, while Independents are more likely than not to say no such duty to vote exists.
Understanding party stances: How well do Americans feel they understand where the two major parties stand on issues important to them? A roughly similar share of U.S. adults say they understand very well where the Democratic (32%) and Republican Parties (30%) stand on important issues. Democrats are more likely to say they have a very good understanding of the Democratic Party's stances (45%) than of the Republican Party's (28%). Likewise, Republicans are more likely to say they understand where the Republican Party stands (40%) than where the Democratic Party does (28%). Independents are about equally likely to understand each of the two major parties' positions.
Election integrity: Two-thirds of Americans (66%) believe the integrity of elections in their state depends either a lot (41%) or a little (25%) on which party controls the state government. Only 15% of people believe the controlling party has no effect. Democrats and Republicans share similar beliefs on this subject, while Independents are less likely to believe party control at the state level plays a role in election integrity.
Paper or electronic: When it comes to voting, do Americans think hand-counted paper ballots or electronic voting machines are more trustworthy? Slightly more say electronic machines are more trustworthy (26%) than say paper ballots are (21%); one in three (33%) believe both are equally trustworthy. Twice as many Democrats say they trust electronic machines (28%) over paper ballots (14%). Republicans are more closely divided: 33% say they trust electronic machines more while 29% say they trust paper ballots more. Far more Democrats (46%) than Republicans (22%) say they trust both voting methods equally.
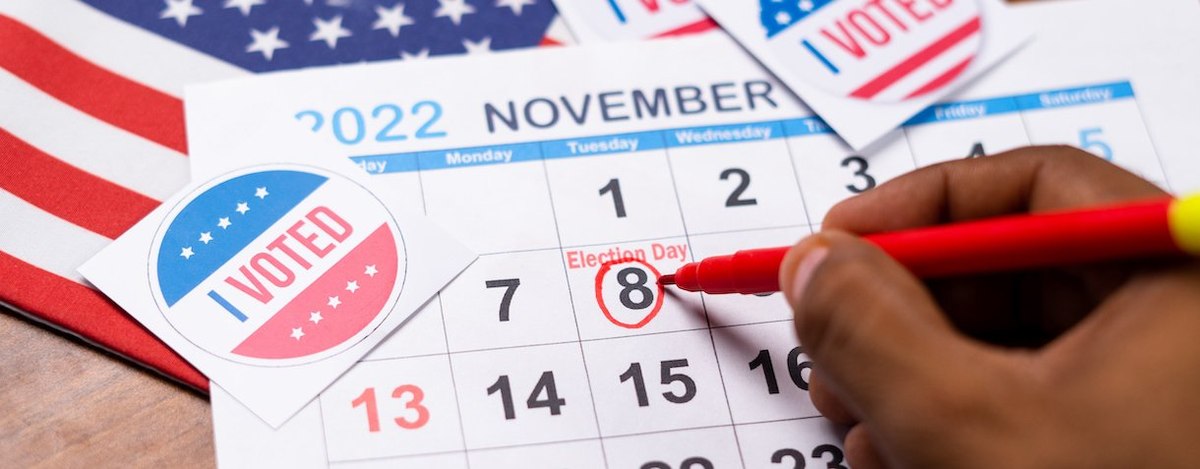
The best day for an election: What day of the week do Americans think is ideal to hold elections? The largest share of people — 25% — think our current system of holding elections on Tuesdays is preferable. The next most popular day is Saturday (13%). Adults under 45 are divided when it comes to the ideal day of the week for an election. Older Americans, on the other hand, are much firmer in their belief in upholding the status quo by keeping Tuesday as Election Day.
Term lengths: How long do Americans think terms should last for members of the U.S. House and Senate? Just 29% say House members' terms should last for the current length of two years, and just 15% think Senate terms should last six years — their current length. Many believe terms for both the House (28%) and Senate (30%) should instead last four years, the current length of a presidential term and of terms for nearly all states' governors.
Sizing up our electoral system: Twice as many Americans believe the U.S. has a better electoral system than other countries around the world do (42%) than believe it has a worse system (20%). However, just 15% believe we have the best electoral system in the world. Belief in the global superiority of the U.S. electoral system is more common among Democrats and Republicans than among Independents.
Voting abroad: Most Americans (55%) believe it is much or somewhat easier to cast a vote in the United States than it is in other democratic countries; 17% believe it is about as easy as in other countries and 14% think it is harder. Younger Americans are less likely than older Americans to believe it's easier to vote in the U.S. than it is in other countries, in part because they are less likely to have an opinion on the subject.
Mail-in mistakes: Americans are generally supportive of election officials notifying voters who make mistakes on their mail-in ballots — such as failing to add a date or adding the wrong one — and allowing them to fix it before Election Day: 54% say voters should be notified and allowed to remedy such issues, while 24% say they should not be. Two-thirds of Democrats (67%) support allowing voters to fix mistakes, compared to about half of Republicans (47%) and Independents (48%).
Outlawing online threats: Most Americans (69%) support a law such as the one recently passed in Washington State that makes it a felony for a person to make online threats against election workers. Democrats (73%) and Republicans (75%) are equally likely to support this legislation.
Long lines: The vast majority of Americans — 81% — believe that people who are in line when the polls close should be allowed to cast their vote (as is currently the case in federal elections). Just 6% of people say a person in line when the polls close should not be allowed to vote.
Covering the campaigns: Americans are more likely to say they prefer election coverage focused on candidates' policy positions (25%) to coverage of which candidates will win (7%). A significant share of people, however, say they prefer both types of coverage equally (42%). Just 16% say they don't like either type of coverage.
Getting to know the candidates: Two in five Americans (40%) say they know at least one person who has run for some type of political office, including themselves (8%), a family member (10%), a friend (15%), or an acquaintance (18%); some people know a candidate from among more than one of those categories of people they know. Half of people (52%) say they don't know anyone in those categories who has run for office.
Religion and politics: Less than one in four Americans (22%) think it should be legal for tax-exempt churches and religious organizations to endorse political candidates, while 46% believe it should be illegal. Republicans (34%) are more likely than Democrats (20%) to think it should be legal. Protestants (32%) and Catholics (28%) are more likely to think it should be legal for churches and religious organizations to endorse candidates than are people who are Jewish (16%) or atheist/agnostic (10%). Despite it being illegal, 53% of Americans think churches do endorse political candidates at least somewhat often; just 25% say they never or don't often do this.
Image: Adobe Stock (WESTOCK)