
New YouGov polling finds that a majority of Americans (65%) think the U.S. is more divided than usual, while 18% think it is about as divided as usual, and 11% think it is more united than usual.
Republicans (73%) are more likely than Independents (65%) and Democrats (59%) to think that the country is more divided than usual. There are also differences in opinion based on where Americans live. Four-fifths (79%) of people who live in the suburbs, 74% in rural areas, and 66% in towns think the country is more divided than usual. However, only 48% who live in a city think the same. City dwellers (23%) are more likely than Americans living in suburbs (5%), towns (10%), and rural areas (1%) to say that the country is more united than usual.
There is less consensus among Americans about division within the political parties. Americans are split on whether Democrats are more divided than usual (26%), about the same as usual (30%), or more united than usual (30%). There is slightly more agreement for the Republican party, with 39% of Americans saying it is more divided than usual. Another 20% say that Republicans are more united than usual, while 28% say they are about the same.
Americans are more likely to say that their own party is united and that the opposing party is divided. For example, Democrats (50%) are more likely than Independents (18%) and Republicans (22%) to say that Democrats are more united than usual. Republicans (36%), on the other hand, are more likely than Independents (27%) and Democrats (16%) to say that Democrats are more divided than usual.
The same pattern holds on the other side of the aisle, with Republicans most likely to think that Republicans are united and Democrats most likely to think Republicans are divided.
While most Americans think the U.S. is more divided than usual, there's no consensus on an even divide in ideology. Only 39% believe that the political ideology of Americans is split equally between liberal and conservative. Another 26% think Americans are completely or mostly liberal, while 20% think that Americans are completely or mostly conservative. Self-described liberals and conservatives don't differ much in their assessment of the ideology of Americans overall.
Americans are more likely to think that city dwellers than rural inhabitants are liberal; city dwellers are less likely to see fellow inhabitants as liberal and more likely to see rural inhabitants that way.
About half of Americans (53%) think that the political ideology of Americans living in cities is completely or mostly liberal, while only 11% think the ideology of city dwellers is completely or mostly conservative. Americans who live in cities (42%) are less likely than those living in suburbs (63%), towns (48%), and rural areas (57%) to say that the political ideology of Americans living in cities is liberal.
Conversely, most Americans (59%) think that Americans living in rural areas are completely or mostly conservative. Americans who live in cities (16%) are much more likely than those in suburbs (6%), towns (8%), and rural areas (3%) to disagree and say that Americans living in rural areas are completely or mostly liberal. Self-described liberals are more likely than self-described conservatives to describe suburban and rural Americans as liberal.
About half of Americans view the growing partisan division between rural and urban voters as very or somewhat bad for the country (48%), while 13% think it is very or somewhat good. A substantial subset of Americans either think this ideological division is neither good nor bad (24%) or are unsure (14%). Republicans (51%) are just as likely as Democrats (50%) to see this partisan division as a bad thing.
— Linley Sanders contributed to this article.
See the results from this YouGov poll
Methodology: This poll was conducted online on April 10 - 14, 2023 among 1,000 U.S. adult citizens. Respondents were selected from YouGov’s opt-in panel using sample matching. A random sample (stratified by gender, age, race, education, geographic region, and voter registration) was selected from the 2019 American Community Survey. The sample was weighted according to gender, age, race, education, 2020 election turnout and presidential vote, baseline party identification, and current voter registration status. Demographic weighting targets come from the 2019 American Community Survey. Baseline party identification is the respondent’s most recent answer given prior to March 15, 2022, and is weighted to the estimated distribution at that time (33% Democratic, 28% Republican). The margin of error for the overall sample is approximately 3%.
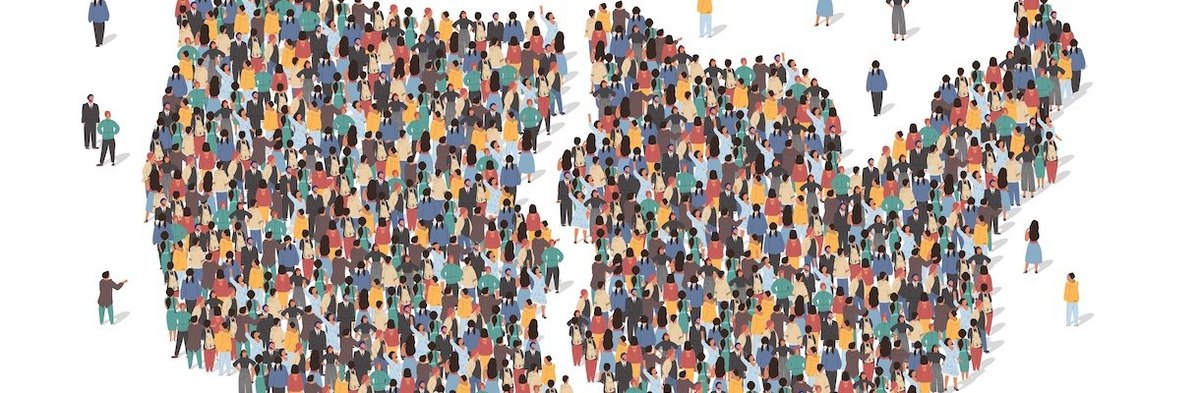
Image: Adobe Stock (Siberian Art)