
In the 2014 midterm elections, YouGov polled every state and congressional district. This note provides detailed information about the performance of YouGov’s Governor polls. Analyses of Senate and House polls are posted separately.
YouGov polled Gubernatorial races four times for CBS News and the New York Times over the course of the campaign with interviewing in the final wave between October 16 and 23. In addition, we conducted separate polls, independent of the CBS/New York Times Battleground Tracker, in the week before the election (October 25-31). These results use our final poll estimates in those five states rather than the earlier results in the Battleground Tracker. The primary differences are that Florida switched from an insignificant Democratic lead to an insignificant Republican lead (eventually Democrats won by about 0.1%), but otherwise we had the same leaders in both polls.
Figure 1: Accuracy of YouGov Governor Estimates
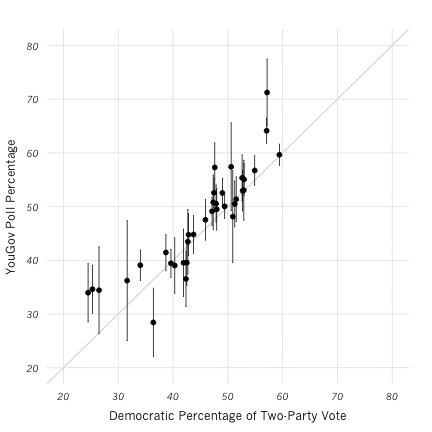
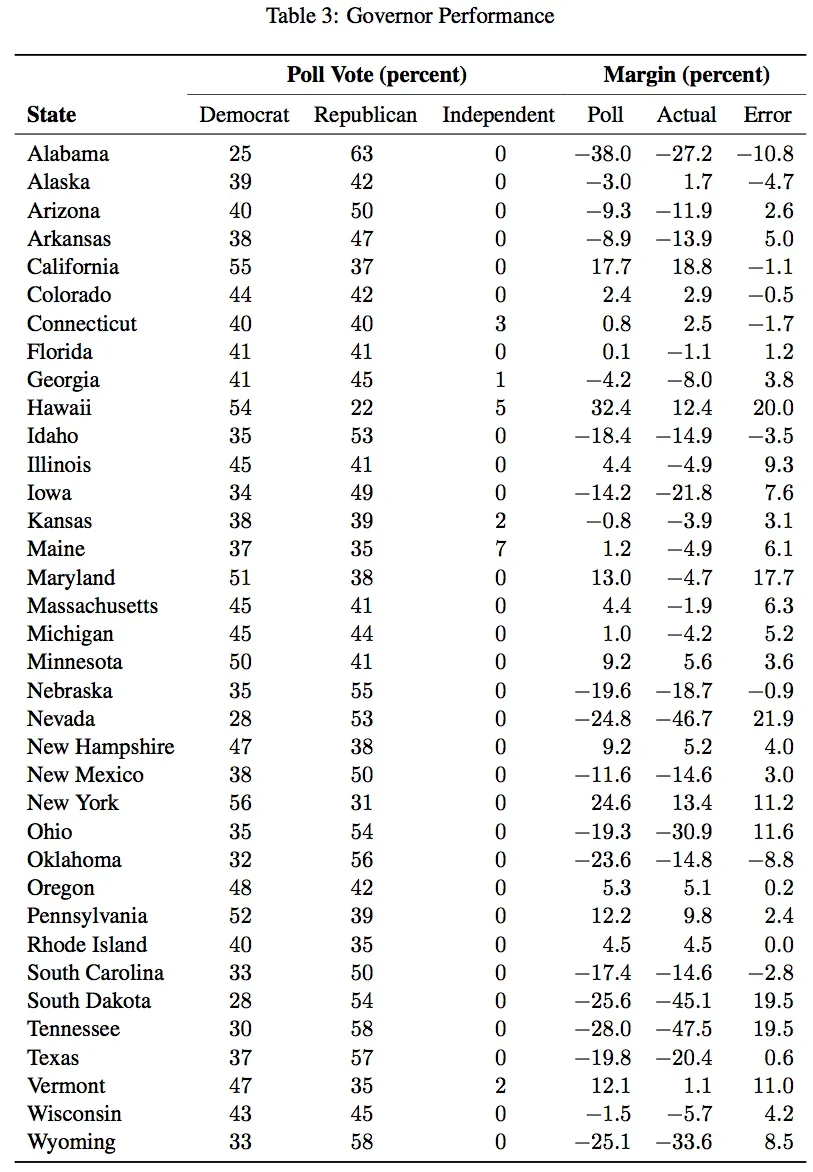
The scatterplot shows the relationship between poll estimates and vote counts from these 36 races. Each point represents a poll estimate. The horizontal coordinate is the vote count and the vertical coordinate the poll estimate, both measured as the Democratic percentage of major party vote. Points on the 45◦ axis have no error. Most of the points are above the 45° indicating a persistent bias in the Democratic direction. Further, many of the estimates are unacceptably far from the 45° line and, in about a third of the contests, the election outcome was not within the margin of error (the 95% confidence interval). This should occur in only five percent of the contests. For races that were reasonably competitive (with Democrats receiving between 40% and 60% of the vote), the points are reasonably close to the 45° line), indicating reasonable performance with the exception of Maryland, where we were far off. We believe the problem in Maryland was due to weighting; without weighting, the winning Republican candidate had a 3.5% lead, which weighting turned into a 13% deficit. However, poll performance was quite poor in many of the uncompetitive Governor’s races. We investigate this further below.
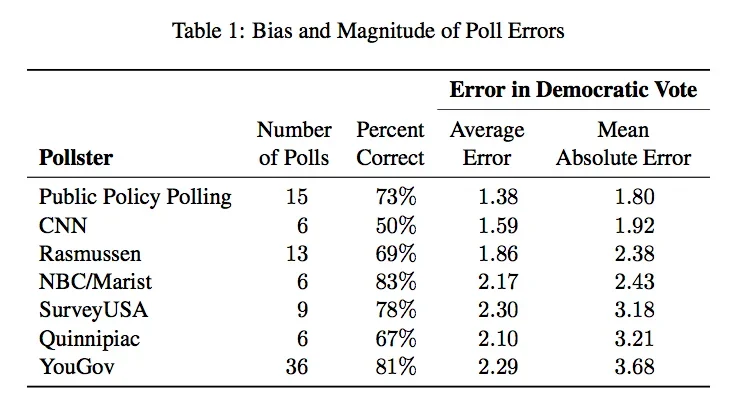
Table 1 compares YouGov’s estimates in Governor’s races with those by other organizations. (We only included organizations that polled in at least five Gubernatorial races in the month preceding the election. Older polls are not used in the computations.) The mean absolute error of our polls was the worst of this set of pollsters, while our bias was in the middle of the group (similar to Quinnipiac, NBC/Marist, and SurveyUSA). If the calculation is confined to states where at least one other organizations polled, our mean error was 2.10 (similar to NBC/Marist and Quinnipiac) and mean absolute error was 3.21 (larger than the others).
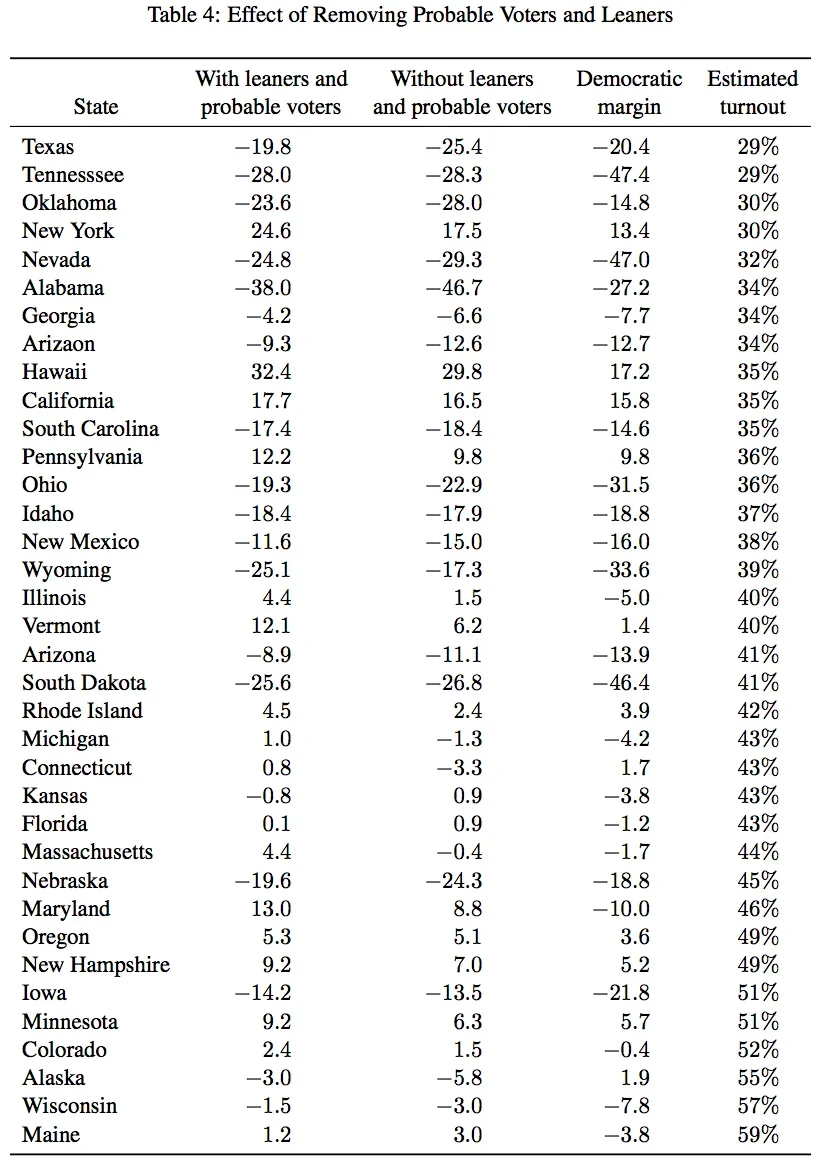
Many of the uncompetitive races where our polls performed poorly also had low turnout. In reviewing the estimates, we have noticed a correlation between Democratic bias and turnout. (We are using preliminary turnout estimates by Michael McDonald.) In our reported estimates, we used a simple likely voter screen—whether the respondent said they would “definitely vote” or “probably vote”—and included undecided leaners in the reported vote estimates. We have recalculated our estimates after restricting likely voters to those who said they would “definitely vote” and not included leaners in the vote estimates. The results are shown in Table 4 of the Appendix and summarized below.
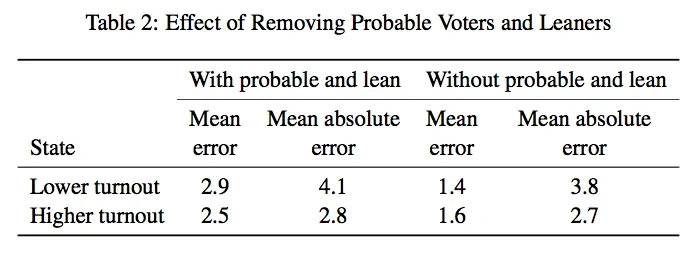
We divided states into two groups based upon their turnout. The 18 states with the lowest turnout (40.2% or less), the overstatement of Democratic vote in our reported estimates was, on average, 2.9% with a mean absolute error of 4.1%. If we use a stricter definition of likely voters and don’t allocate leaners, the overstatement of Democratic vote is cut nearly in half (to an average of 1.6%) with a mean absolute error of 2.7%. The same adjustment reduces the bias in the 18 states with higher turnout (above 40.2%) from 2.5% to 1.6%, but has little impact on the average absolute error. These are not the estimates we reported and one must be wary of post hoc adjustments. But it does appear that the likely voter screen was too loose, especially in states where voter engagement was low.
This entry has been updated to correct an error in Table 1 and adjusts the language in the article that refers to Table 1. The results for SurveyUSA were reported incorrectly in the original article.
Updated on November 18, 2014 to reflect new vote counts.