

New polling by the Economist/YouGov finds that Americans generally have positive perceptions of labor unions, with 53% viewing them very or somewhat favorably and 31% very or somewhat unfavorably. In several recent high-profile strikes, Americans are far more likely to side with union workers than with the companies involved.
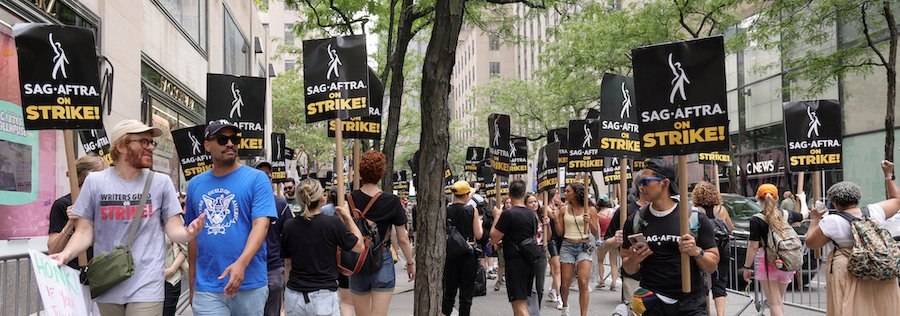
In the strike by film and television writers and actors, 52% of Americans are more inclined to side with the unions, while just 12% side with studios and streaming services. The autoworkers strike receives similar support, with half (51%) siding with the United Auto Workers and just 17% siding with Ford, General Motors, and Stellantis.
In principle, Republicans do not think highly of labor unions: About half (49%) hold unfavorable views of unions while 39% view them favorably. But Republicans are more pro-union when it comes to the two current strikes — as are Democrats and Independents. Republicans are as likely to side with the UAW (34%) as with the involved automakers (32%) and are more likely to side with writers and actors unions (37%) than with studios and streaming services (20%). (The Writers Guild agreed to a settlement just as this week’s poll was ending.)
For each of these two strikes, relatively few Americans — less than one-quarter — expect it will affect them personally either a great deal or a fair amount.
— Carl Bialik contributed to this article
See the toplines and crosstabs from the Economist/YouGov poll conducted on September 23 - 26, 2023 among 1,500 U.S. adult citizens.
Methodology: Respondents were selected from YouGov’s opt-in panel using sample matching. A random sample (stratified by gender, age, race, education, geographic region, and voter registration) was selected from the 2019 American Community Survey. The sample was weighted according to gender, age, race, education, 2020 election turnout and presidential vote, baseline party identification, and current voter registration status. Demographic weighting targets come from the 2019 American Community Survey. Baseline party identification is the respondent’s most recent answer given prior to November 1, 2022, and is weighted to the estimated distribution at that time (33% Democratic, 31% Republican). The margin of error for the overall sample is approximately 3%.
Image: Getty (Michael Loccisano)