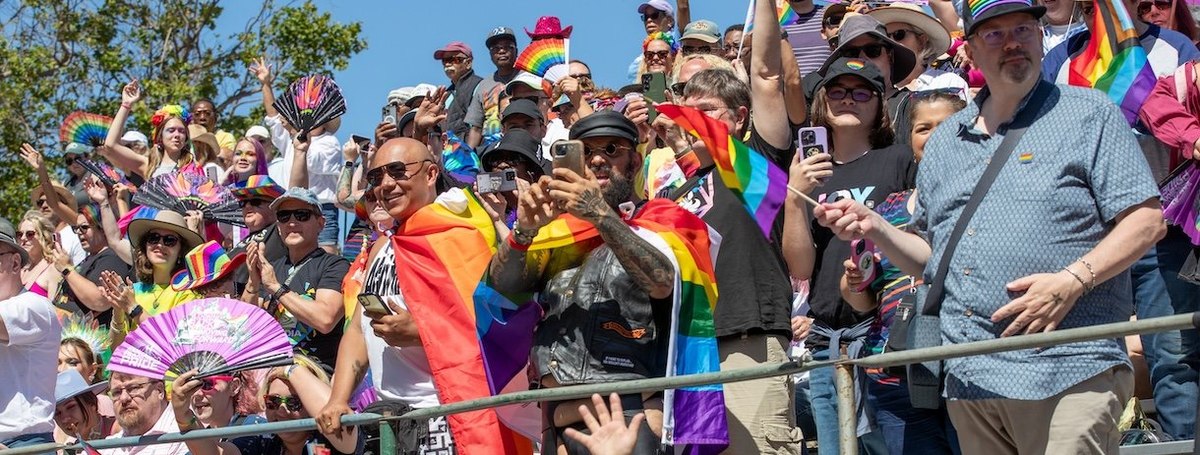
A new YouGov survey explores which of the two main political parties Americans feel represent different racial, socioeconomic, religious, and occupational groups. Among Americans, majorities feel that the Democratic Party is more the party of LGBTQ+ people, Black Americans, and students than the Republican Party is; the Republican Party is more often seen as more the party of Christians, men, and the wealthy.
Each major party is seen by far more Americans as the party of certain groups than the other party is. Majorities of Americans see the Democratic Party as more the party of LGBTQ+ people (75%), Black Americans (56%), students (55%), people in cities (55%), and women (55%). Majorities see the Republican Party as more the party of Christians (59%), men (55%), and the wealthy (54%). Around half also see the Republican Party as the party of people in rural areas (53%), white Americans (51%), and farmers (50%).
For some groups though, Americans are divided about which major party fits them more. 30% see the Democratic Party as being more the party of families; 30% say the Republican Party is. Similarly, near-equal shares see the Democratic Party (37%) and Republican Party (35%) as more the party of the working class. 35% of Americans see the Democratic Party as more the party of the middle class and 34% say the Republican Party is.
There have been some changes since the question was last asked, in February 2024. In February, 43% of Americans said the Republican Party is the party of men; that number has since risen to 55%. There also has been an increase in the number of Americans who see the Republican Party as the party that is more representative of senior citizens, from 37% in February to 46% now.
Among Americans, more now see the Democratic Party as more the party of people in cities (47% in February to 55% now), teachers (45% to 54%), and health care workers (34% to 43%).
How do Democrats and Republicans view their party — and the other major party? Large majorities of Democrats see the Democratic Party as more the party of LGBTQ+ people (85%), Black Americans (80%), Women (79%), and young adults (78%).
Among the 30 groups asked about, the ones Democrats are least likely to say the Democratic Party is more the party of are the wealthy (12%) and white Americans (22%).
Republicans are most likely to say the Republican Party is more the party of farmers (75%), veterans (74%), Christians (73%) and small business owners (73%). For the 30 groups asked about, Republicans are least likely to see their party as more the party of LGBTQ+ people (7%) and Muslims (12%) than the Democratic Party.
70% of Democrats view the Republican Party as more the party of the wealthy; 47% see it as more the party of men and 44% see it as more the party of white Americans. Among Republicans, 77% see the Democratic Party as more the party of LGBTQ+ people, 48% think it is more the party of people in cities, and 44% think it is more the party of students.
The survey also asked what Americans expect after the presidential election in November. Most Americans (56%) think it is very or somewhat likely that there will be a peaceful transition of power after the 2024 presidential election. Democrats (65%) are more likely than Republicans (58%) to believe this.
If Harris is declared the winner, 53% of Americans — including 61% of Democrats and 54% of Republicans — think it is likely there will be a peaceful transition of power. If Trump is declared the winner, 55% of Americans, including 57% of Democrats and 65% of Republicans, think a peaceful transition is likely.
— Taylor Orth and Carl Bialik contributed to this article
Related:
- How Americans describe the Democratic and Republican parties
- Kamala Harris would out-cook, out-dance, and out-dress Trump, Americans say
- How Americans want the government to handle the issues that matter most to them
See the results for this YouGov poll.
Methodology: This YouGov poll was conducted online on August 21 - 25, 2024 among 1,083 U.S. adult citizens. Respondents were selected from YouGov’s opt-in panel to be representative of adult U.S. citizens. The sample was weighted according to gender, age, race, education, 2020 election turnout and presidential vote, baseline party identification, and current voter registration status. Demographic weighting targets come from the 2019 American Community Survey. Baseline party identification is the respondent’s most recent answer given prior to November 1, 2022, and is weighted to the estimated distribution at that time (33% Democratic, 31% Republican). The margin of error for the overall sample is approximately 4%.
Image: Getty (Miikka Skaffari / Stringer)


