
This week’s Economist/YouGov poll covers…
- The increasing share of Americans who are feeling the government shutdown's effects
- How many Americans want the government to try to reduce wealth inequality
- Whether liberals prefer capitalism or socialism
- The level of support for a possible resumption of nuclear-weapons testing
- Whether Americans think pro athletes often tailor their play to gambling outcomes
Government shutdown
- A growing share of Americans say they are being personally affected by the government shutdown: 36% say they are being affected a great deal or somewhat, compared to 21% who said so roughly a week after the shutdown began
- Americans are about as likely to say that Republicans in Congress are most responsible for the shutdown as they are to say Democrats in Congress are (35% vs. 32%); 28% say the two groups are equally responsible
- There has been little change in opinion on responsibility for the shutdown since two weeks earlier. The share who place the most blame on congressional Republicans is down slightly, to 35% from 39%
- Trump, Democrats in Congress, and Republicans in Congress all continue to have net negative approval among Americans for their handling of the shutdown. Net approval of shutdown handling by Trump has fallen in recent weeks, as has net approval of Republicans in Congress, to a lesser extent
- How much longer do Americans expect the shutdown to last? 35% say they expect it to last another three weeks or more and 23% anticipate it will last another two weeks or less. Many (42%) say they are not sure how long it will last
- Americans are about as likely to say that Democrats in Congress should hold out for changes to health care funding — such as extending subsidies for Affordable Care Act (ACA) coverage — before agreeing to end the government shutdown as to say they should not (40% vs. 38%)
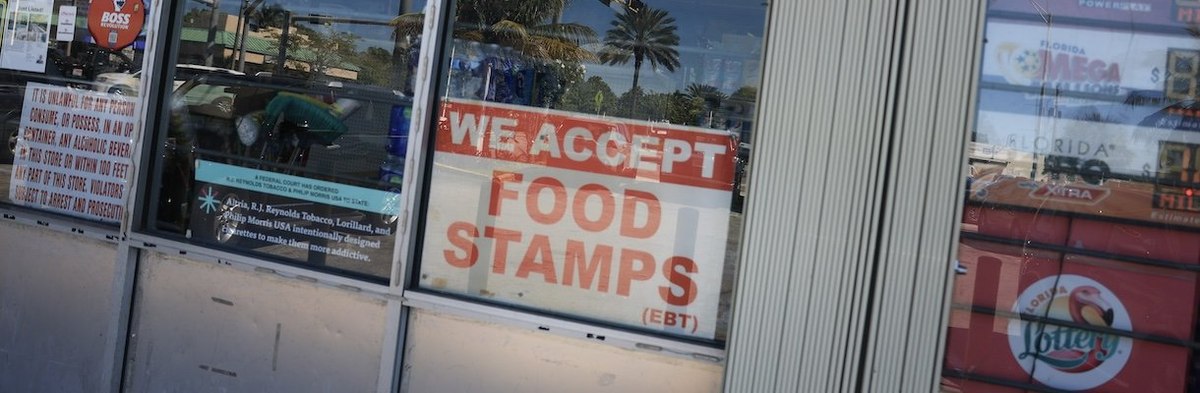
- 28% of Americans — including 33% of Democrats and 24% of Republicans — say someone in their family currently receives benefits from the Supplemental Nutrition Assistance Program (SNAP), sometimes called food stamps
- Three-quarters (74%) of Americans think that SNAP benefits should continue to be paid during the shutdown. People who say someone in their family receives SNAP benefits are more likely to support continued payment of the benefits during the shutdown than are those who do not (91% vs. 67%)
Wealth inequality
- 84% of Americans — including majorities of Democrats (96%), Independents (87%), and Republicans (68%) — say the rich have too much political power in the U.S.
- A majority (54%) of Americans describe the gap between the rich and the poor in the U.S. as a very big problem and 57% say the federal government should pursue policies that reduce this gap
- Two-thirds (69%) of Americans support and 18% oppose raising the federal minimum wage to $15 per hour. Support for an increase is similar among Americans with lower and higher family income
- What do Americans think is primarily responsible for determining why some people are richer than others? Twice as many say whether a person comes from a privileged background is more important than say how hard a person works is (39% vs. 20%); 35% say both of these factors are equally important
- 64% of Americans say that billionaires in the U.S. are taxed much or somewhat too little; 18% say they are taxed about the right amount and 7% say the amount they are taxed is too high
- Americans are far more likely to view capitalism as a better economic system than to think socialism is (46% vs. 18%).
- Opinions on which system is better vary by political ideology
- A majority of those who identify as very liberal prefer socialism (59%)
- Those who identify as liberal — but not very liberal — are nearly evenly divided on which system is better
- Moderates and conservatives strongly prefer capitalism to socialism
- Opinions on which system is better vary by political ideology
- 52% of Americans expect that when children today in the U.S. grow up, they will be worse off financially than their parents; only 13% think they will be better off
- 69% of employed Americans think that if they lost their job, it would be somewhat (45%) or very (25%) hard for them to find a new job that paid as much as they're making now; only 22% think it would be not very hard
- 21% of Americans think the economy is getting better; 54% say it is getting worse, up from 37% at the start of Trump's second term
Nuclear weapons
- More Americans say that the U.S. having nuclear weapons makes them feel safer than say it makes them feel less safe (37% vs. 21%); 35% say it makes them feel neither safer nor less safe
- Americans are more likely to strongly or somewhat oppose than to support the U.S. resuming its testing of nuclear weapons (48% vs. 33%) — a change Trump recently proposed
- More Americans strongly or somewhat disapprove than approve of Trump's handling of nuclear weapons (45% vs. 32%). Democrats overwhelmingly disapprove (81% vs. 6%). Republicans overwhelmingly approve (70% vs. 9%)
Sports betting
- 29% of Americans — including 40% of men and 18% of women — say they have ever bet money on a sporting event
- Nearly half (47%) of Americans think that legalized gambling is having a negative impact on sports; only 7% say its impact is positive and 30% say it is neither negative nor positive
- People who have bet on sports before are less likely to view the impact of legalized sports betting on sports as negative than are people who have never placed a sports bet (33% vs. 52%), though the people who have bet on sports still are more likely to say legalized betting on sports is negative than positive (33% vs. 19%)
- Twice as many Americans believe that professional athletes frequently or sometimes alter the way they play to help sports gamblers win bets than think they rarely or never do this (49% vs. 25%)
— Carl Bialik contributed to this article
Throughout this report, some numbers may appear to be off by 1 because of rounding
See the toplines and crosstabs for the October 31 - November 3, 2025 Economist/YouGov Poll
Methodology: The poll was conducted among 1,656 U.S. adult citizens. Respondents were selected from YouGov’s opt-in panel to be representative of U.S. adult citizens. A random sample (stratified by gender, age, race, education, geographic region, and voter registration) was selected from the 2019 American Community Survey. The sample was weighted according to gender, age, race, education, geographic region, 2024 presidential vote, 2020 election turnout and presidential vote, baseline party identification, and current voter registration status. 2024 presidential vote, at time of weighting, was estimated to be 48% Harris and 50% Trump. Demographic weighting targets come from the 2019 American Community Survey. Baseline party identification is the respondent’s most recent answer given around November 8, 2024, and is weighted to the estimated distribution at that time (31% Democratic, 32% Republican). The margin of error for the overall sample is approximately 3.5%.
Image: Getty (Joe Raedle / Staff)
What do you really think about President Trump, American politics in general, and everything else? Share your reality, join the YouGov panel, and get paid to share your thoughts. Sign up here.