

The unofficial Queen of Christmas, Mariah Carey, has triumphed in our Christmas song ranking, but she’s sharing the spotlight this year.
In a YouGov poll of 1,200 US adults, we asked America about their favorite Christmas tune. The results are in, and it's a tie between “Silent Night” (13%) and “All I Want for Christmas is You” (13%). There’s also a tie for second place, between “O Holy Night” (12%) and “Jingle Bell Rock” (12%).
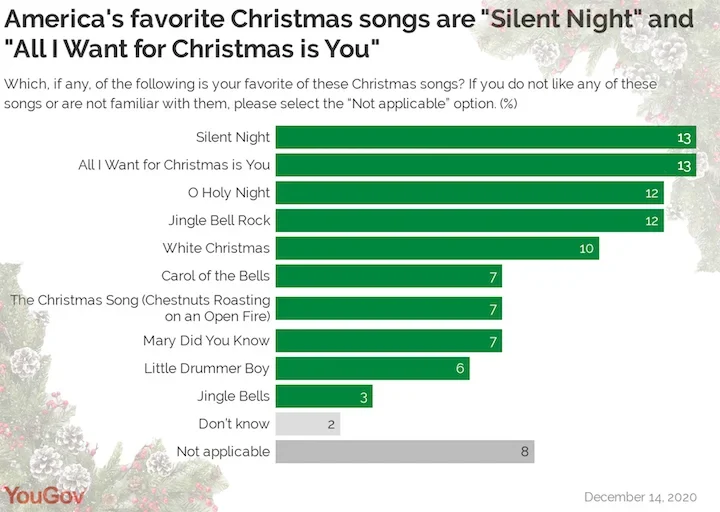
The shortlist was based on the top ten responses to a previous survey in which YouGov asked Americans to write in their favorite Christmas song.
One in 10 say “White Christmas” is their favorite Christmas song, with “Carol of the Bells,” (7%) “The Christmas Song,” (7%) and “Mary Did You Know” (7%) not far behind. “Little Drummer Boy” (6%) and “Jingle Bells” (3%) round out the list.
As with many pop culture topics, there are some generational differences. Millennials are especially partial to “All I Want for Christmas is You,” (18%) while the top tune among Generation X is “Jingle Bell Rock” (16%). Baby Boomers, meanwhile, are partial to the hymns “O Holy Night” (18%) and “Silent Night” (16%).
YouGov also asked Americans about the holiday songs they simply can’t stand. About one in six (17%) say the Christmas song they dislike the most is “Grandma Got Run Over by a Reindeer,” while 15% say they most dislike the 1953 tune “I Want a Hippopotamus for Christmas.” In third place is “Santa Baby,” with 8%, followed by “I Saw Mommy Kissing Santa Claus” (6%) and “Baby, It’s Cold Outside” (5%).
See full results here.
Related: The most and least popular Christmas cookies
Methodology: 1,500 US adults were asked via YouGov Direct, “What is your favorite Christmas song? If you do not have a favorite Christmas song, please write in ‘N/A’” and “What Christmas song do you dislike the most? If you do not have any Christmas songs you dislike, please write in ‘N/A.’” The 10 most common responses then tested in closed-end questioning during a second wave of interviews with 1,200 US adults on December 14, 2020. The data shared in this article reflect results from this second wave. Data is weighted on age, gender, education level, political affiliation, and ethnicity to be nationally representative of adults in the United States. The margin of error is approximately 2.8% for the overall sample.
Image: Getty